Abstract
The global resurgence of industrial policy has revived the appeal of downstream diversification (beneficiation) – adding value to raw materials – as a development strategy. Despite this intuitive appeal, empirical evidence of its effectiveness remains scarce, with few real-world success stories. We address this gap through a novel empirical analysis of export product co-location and new relatedness metrics to explain observed diversification patterns. Our results show that product co-location patterns are driven primarily by similarities in occupational structures. Industries sharing high-skill occupations (and to a lesser extent, non-tradable inputs) are strong predictors of diversification. Conversely, relatedness metrics based on value-chain linkages (existing upstream inputs) have weak to no predictive power.
productive diversification ∗ Sebastián Bustos † , Miguel Angel Santos ‡
Abstract The global resurgence of industrial policy has revived the appeal of downstream diversification (beneficiation) – adding value to raw materials – as a development strategy. Despite this intuitive appeal, empirical evidence of its effectiveness remains scarce, with few real-world success stories. We address this gap through a novel empirical analysis of export product co-location and new relatedness metrics to explain observed diversification patterns. Our results show that product co-location patterns are driven primarily by similarities in occupational structures. Industries sharing high-skill occupations (and to a lesser extent, non-tradable inputs) are strong predictors of diversification. Conversely, relatedness metrics based on value-chain linkages (existing upstream inputs) have weak to no predictive power. These findings suggest rethinking development strategies focused on adding value to raw materials. Instead, countries should promote industries that build on existing know-how – particularly those with similar occupational structures or non-tradable capabilities already present in the economy.
1 Introduction
The idea that countries can accelerate development by adding value to their natural resources –commonly referred to as beneficiation– has deep historical roots and enduring ∗ We would like to thank Clement Brenot, Ricardo Hausmann, Carlo Pietrobelli, and Muhammed Yildirim for useful comments and suggestions, as well as seminar and workshop participants at the Harvard Growth Lab, the School of Government and Public Transformation at Tecnológico de Monterrey, and attendants to the UNU-MERIT CatChain Symposium in Amsterdam, February 2024. We thank Benedikt Margraf and Kathia Garcia for excellent research assistance. The usual disclaimers apply.
intuitive appeal. Drawing on the historical legacy of structuralist thought of Prebisch and Singer, and Hirschman’s influential theory of backward and forward linkages, the notion that resource-based economies can evolve by building upstream and downstream capabilities has shaped decades of policy. In recent years, the global resurgence of industrial policy has brought this idea back to the center of many national strategies, especially in mineral and energy-rich economies. Yet, despite its popularity in both policy and rhetoric, there is a striking shortage of empirical evidence to support the effectiveness of beneficiation. As a matter of fact, few resource-rich countries have transitioned from exporting raw materials to significant exporters of processed goods, and the few that have, did so under conditions not easily replicable. 1 This paper fills that gap by examining the relative importance of beneficiation versus the role of other productive capabilities in explaining industrial development across countries. We leverage detailed country-level export data and introduce new metrics of industry relatedness to assess which dimensions –value-chain linkages or knowledge-based capabilities– better account for the diversification paths observed in practice. Our empirical strategy relies on two complementary approaches. First, we examine whether patterns of industry co-location across countries are primarily driven by input-output connections or by knowledge-based factors, proxied through similarities in occupational structures and patent activity. Second, we analyze whether the entry or exit of exporting industries over time can be explained by the presence of related industries at baseline. These metrics allow us to test competing hypotheses: does industrial upgrading tend to occur through downstream processing of existing raw materials, or through the redeployment of skills and capabilities already embedded in the domestic economy.
Our findings suggest that, while some randomness exists in co-location patterns and industry turnover, forward linkages –as a proxy for beneficiation– provide limited to zero 1 Many developing economies implement industrial policies to selectively promote certain sectors, aiming to replicate the rapid growth experiences of Japan (1950s–1970s), South Korea and Taiwan (1960s–1980s) and, more recently, China. One of the oldest and most debated questions in economics is how industrial policies can effectively foster economic development – a challenge famously framed by Hirschman (1958).
explanatory power. These results hold even when the analysis is restricted to natural resource sectors or the diversification trajectories of resource-rich countries. 2 In contrast, knowledge-based measures – particularly those linked to high-skill occupations and shared technological intensity – offer a more robust and consistent explanation where new industries are likely to emerge. They also help explain where previously competitive sectors lose their foothold in global markets. These results provide much-needed empirical grounding for ongoing industrial policy debates, suggesting a shift in emphasis from supply chain integration towards the development of localized knowledge ecosystems.
This paper is organized as follows. We first review the beneficiation literature –its historical roots and current influence on national strategies– and contrast it with knowledgebased diversification centered on capabilities and human capital. We then describe the data and methods, outlining two empirical approaches. Next, we present results and robustness checks. We conclude with policy implications.
2 Literature review
The strategy of fostering industrialization by adding value to natural resources has deep historical roots in development economics. Early structuralists like Raúl Prebisch and Hans Singer argued that commodity-dependent countries faced deteriorating terms of trade and needed to transform their export structures – a view that set the stage for later advocacy of resource-based industrialization (Prebisch, 1950; Singer, 1950). Perhaps the most influential theoretical foundation came from Albert Hirschman in “The Strategy of Economic Development” (1958), which introduced the notion of backward and forward linkages as 2 The long-debated “resource curse” (Sachs and Warner, 1995) has been studied recently through the lens between resource wealth and low economic diversification, as natural resources come to dominate exports without other sectors taking off(Ross, 2017; Bahar and Santos, 2018; Lashitew, Ross and Werker, 2021). Such concentration heightens vulnerability to commodity-price volatility and resource depletion (Devlin and Titman, 2004; Venables, 2016; Van Der Ploeg and Poelhekke, 2019). It can also establish rent-heavy extractive sectors, preventing the development of market and political institutions needed for broad-based and inclusive growth (Pritchett, Sen and Werker, 2018).
channels through which one industry can spur the development of others. Hirschman argued for “unbalanced growth”, suggesting that investing in sectors with strong linkages could induce broader economic expansion even if resources were limited. Unlike more abstract development theories of the time, his framework was considered actionable, aided by the proliferation of national input-output tables that allowed empirical estimation of linkage strength.
While Hirschman’s thesis does not explicitly reference Marshallian externalities, his theory of linkages shares important conceptual ground with them. Both frameworks emphasize that industrial development is not an isolated process but driven by interdependencies across firms or sectors. However, the mechanisms and drivers differ: Hirschman’s backward and forward linkages are sectoral and directional (anchored in input-output relationships). In contrast, Marshallian externalities –central to urban economics– are spatial and non-directional, highlighting local productivity gains from input sharing, labor pooling, and knowledge spillovers within industry clusters (Ellison, Glaeser and Kerr, 2010).
While Hirschman was concerned with national-scale sequencing of industrial growth, the Marshallian framework emphasizes microeconomic benefits of geographic proximity. Recognizing this distinction helps bridge development theory with insights from economic geography, especially when studying co-location patterns and the role of capabilities in shaping diversification.
Hirschman’s linkage concept provided intellectual justification for postwar policies like import-substituting industrialization (ISI). Many developing countries in Latin America, Africa, and Asia pursued beneficiation-like strategies in the 1960s and 1970s under the belief that nurturing industries “upstream” or “downstream” of their primary commodities would spark self-sustaining industrial growth. Hirschman himself was cautiously optimistic yet nuanced: he warned that simply having linkages on paper was not enough, successful realization of linkages required entrepreneurial responses, learning-by-doing, and support-
ive institutions. 3 The influential role of linkages as a guiding principle of economic development plans has persisted despite limited theoretical foundations and scant empirical validation. 4 Rather than providing a historical account, it is perhaps more useful to highlight how the idea of beneficiation –rooted in the logic of forward and backward linkages– remains active and influential, shaping national strategies across Africa, Asia, and Latin America. National development plans (NDP) continue to frame structural transformation as moving downstream along existing resource or agricultural value chains.
In South Africa, the NDP 2030 identifies priority areas where beneficiation is likely to lead to downstream manufacturing, asserting that it can “raise the unit value of South African exports” and spur “resource-cluster development, including the identification of sophisticated resource-based products that South Africa can manufacture.” 5 Nigeria’s NDP 2021–2025 similarly promotes “a backward integration strategy to encourage the beneficiation of primary resources” as well as “enhanced local value addition through backward and forward linkages.” 6 Kenya’s Vision 2030 outlines plans to develop “a robust, diversified, and competitive manufacturing sector” by “exploiting opportunities in value addition to local agricultural produce” and “adding value to intermediate imports and capturing the ‘last step’ of value addition in metals and plastics. 7 Ethiopia’s Ten-Year NPD (2021-2030) highlights “cre- 4 Critics have argued that policies aimed at inducing investment based on expected linkage effects were misguided, asserting that the key drivers of industrial development are comparative advantage rooted in factor endowments and technological differences as in the Heckscher–Ohlin or Ricardian traditions. Classic critiques of linkage-driven import-substitution include Little, Scitovsky and Scott (1970), Balassa (1971), Bhagwati (1978), and Krueger (1978). More recently, Lin (2012) contrasts “comparative-advantagefollowing” with “comparative-advantage-defying” strategies and argues that many failures of heavy-industry targeting interventions stem from violating comparative advantage rather than from a lack of linkages. Without a clear articulation of the underlying market failure, Hirschman’s concept of linkages has been dismissed by some as lacking economic rigor or practical relevance. Puga and Venables (1999), for instance, contend that such linkages are “of no particular economic significance.”
ating value additions to export commodities” as key to sustaining growth and reducing import dependence, by identifying opportunities in priority sectors “through input-output linkages.” 8 One of the key pillars of Tanzania’s National Five-Year NDP 2021-2026 are the policy “interventions to further deepen industrialisation, driven by STI capabilities for value addition in manufacturing and productive sectors”, aimed at “increasing Tanzania’s participation in global and regional trade in which exports shall embody local value addition.” 9 The Democratic Republic of Congo’s NDP 2022–2026 calls for “industrialization through local processing of natural resources” to capture more value from copper, cobalt, and agricultural commodities. 10 This has also been a long-standing aspiration of Namibia, whose governing party SWAPO’s election manifesto is titled “Unity in Diversity: Natural Resources Beneficiation and Youth Empowerment for Sustainable Development” and portrays beneficiation as the cornerstone of industrial growth and prosperity: “Value addition to local products, and beneficiation of natural resources shall be used to create sustainable value chains to be able to boost economic growth and prosperity for the entire Namibian Populace.” 11 Outside Africa, similar aspirations recur. Indonesia’s National Medium-Term Development Plan 2025 links export taxes and bans on unprocessed nickel, tin, and bauxite to the goal of fostering domestic refining capacity and attracting smelter investment (Cahyaningrum, 2023). 12 With the global surge in battery demand, lithium-rich developing countries –such as Chile and Bolivia– have sought to retain more value domestically by restricting raw lithium exports and fostering downstream industrial development. In Chile, the government renegotiated existing contracts in 2021 to ban raw brine exports and require on-site production of lithium carbonate or hydroxide –the initial stages of
lithium refining– aiming to “move beyond raw export to encompass advanced processing and battery materials production.” 13 In Bolivia, legislation mandates domestic processing and prohibits the export of raw brine, requiring that lithium chloride, sulfate, hydroxide, and carbonate be produced within Bolivia (von Vacano, 2024).
Together, these strategies display a persistent developmental narrative in which beneficiation represents both industrial ambition and economic sovereignty.
The predominance of beneficiation and value addition in national development plans across the world stands in sharp contrast with the shortage of empirical evidence documenting its effectiveness. Among those systematically testing the role of linkages –and particularly the case for beneficiation– we find the papers of Hausmann, Klinger and Lawrence (2008), Blonigen (2016), Rachapalli (2024), and Lane (2025).
Using global export data, Hausmann, Klinger and Lawrence (2008) examine whether resource-rich countries develop downstream manufacturing linked to their primary exports.
They found that very few exporters of raw materials also export processed forms, and that transitions to greater processing are rare. Forward linkages appear to play a minimal role relative to standard determinants of comparative advantage, despite decades of policy efforts to promote downstream diversification. 14 This study has some shortcomings that we are aiming to address in this paper. First, it uses co-location of exports as a proxy for value-chain proximity, a problematic choice as it captures other effects associated to agglomeration externalities. 15 Second, their skill-relatedness measure is not derived directly from occupational data at the industry level but rather based on much coarser datasets such as Leamer’s commodity groupings, and Lall’s technological sophistication (Leamer, 1984; Lall, 2000).
Blonigen (2016) evaluates the impact of industrial policies in the steel sector –a classic 13 Gobierno de Chile (2023), page 7. 14 This point has been more formally made by Ostensson (2019) for the case of Africa: Attempts to measure the effectiveness of value-chain linkages vs. knowhow or skill-based diversification are biased towards the former after decades of efforts to promote upstream and downstream diversification.
upstream industry– on downstream performance of export manufacturing across countries. 16 Using a unique data set covering steel-sector interventions (tariffs, production subsidies, export subsidies, etc.) from 1975–2000, finds that ramping up protection for steel tended to hurt downstream industries that rely on steel inputs. On average, one-standarddeviation increase in industrial policy intensity leads to a 3.6% decline in downstream export performance – with effects reaching up to 50% for sectors that rely heavily on steel.
The negative impacts are largely driven by export subsidies and non-tariffbarriers and are particularly pronounced in developing countries. These results challenge the beneficiation logic and suggest that making an upstream input artificially cheap or abundant domestically does not automatically create a competitive downstream industry. To the contrary, it may backfire by removing incentives to remain efficiency or by provoking retaliatory trade measures that hit downstream exports.
Rachapalli (2024) contributes new empirical evidence on vertical spillovers within global value chains (GVCs). Using highly disaggregated trade data for 70 countries between 1996–2018, matched with input–output relationships constructed from Indian firm-level data, the paper shows that revealed comparative advantage in a product improves in response to exogenous demand shocks in upstream or downstream products. In other words, positive shocks in one stage of the value chain (e.g. yarn or shirts) increase the likelihood of competitiveness in adjacent stages (e.g. fabric). The results suggest that participation in GVCs can generate dynamic gains by facilitating expansion into new stages of production. The study also documents strong heterogeneity across sectors: food and beverages exhibit large vertical spillovers, whereas mining and chemicals show negligible effects. For 16 Despite extensive research on trade protection, few studies focus on its downstream effects. Hoekman and Leidy (1992) and Sleuwaegen, Belderbos and Jie-A-Joen (1998) propose a theory of cascading protection, where upstream protection increases the likelihood of protection in downstream sectors. Feinberg and Kaplan (1993) find empirical support for this in U.S. antidumping (AD) and countervailing duty (CVD) cases. Other studies, such as Krupp and Skeath (2002), show that AD protection negatively impacts downstream production. Similarly, Liebman and Tomlin (2007) find U.S. steel safeguards harmed steel-using industries, though the magnitude was not clearly linked to steel’s cost share.
resource-rich economies pursuing beneficiation, this implies that forward linkages may materialize in some industries but not others, depending on sectoral characteristics and the nature of learning opportunities along the chain.
Lane (2025) provides one of the most rigorous recent empirical analyses of South Korea’s industrial policy during its 1970s Heavy and Chemical Industry (HCI) drive. Using a difference-in-differences approach that compares industries explicitly targeted under the 1973–79 HCI program to non-targeted sectors, Lane finds substantial positive effects: targeted industries experienced significant gains in output growth, productivity, and dynamic comparative advantage. 17 Leveraging input–output data, the study also documents meaningful forward linkage effects – downstream sectors that relied on inputs from targeted industries exhibited improved output performance and export competitiveness. 18 South Korea’s experience is often viewed as a best-case of linkage-based industrial policy, but it is hard to replicate—especially for resource-rich economies without a broad industrial base or strong institutions. The lesson is that forward linkages from upstream sectors (e.g., steel, petrochemicals) can catalyze wider upgrading only when embedded in a coherent, internally consistent strategy. Korea’s success rested not on mandates or export restrictions, but on targeted investment, performance-based incentives, export orientation, and macroeconomic stability. Indeed, scholars such as Peter Evans (Embedded Autonomy, 1995), Alice Amsden (Asia’s Next Giant, 1989), and Atul Kohli (State-directed development, 2004) have interpreted Korea’s success through this lens – emphasizing sequencing, state-led inducement, and the systematic exploitation of linkage effects. 19 By contrast, current beneficiation efforts target sectors like lithium or bauxite, which are often less em- 18 A closely related contribution is Liu (2019), who develops a general equilibrium model of industrial policy in production networks and shows that distortions accumulate upstream, making subsidies to upstream sectors potentially welfare enhancing. While Liu provides a theoretical rationale for targeting upstream industries due to amplification along the value chain, Lane (2025) offers empirical support by documenting forward spillovers and durable gains during South Korea’s HCI drive. Taken together, these papers underscore both the theoretical logic and practical effectiveness of well designed upstream interventions.
bedded in domestic production networks and exhibit weaker spillover potential. Without complementary policies to build downstream capabilities, such strategies are unlikely to generate the transformational effects seen in Korea’s HCI program.
Our paper addresses two gaps in the literature. First, no study systematically compares the explanatory power of input–output linkages (the basis of beneficiation arguments) with knowledge-based relatedness measures such as occupational or technological proximity; existing attempts either use coarse proxies (Hausmann, Klinger and Lawrence, 2008) or focus on single sectors (Blonigen, 2016). Second, it remains unclear whether cross-country diversification reflects downstream processing of natural resources or the redeployment of knowledge-based capabilities. By decomposing export co-location and explicitly testing alternative relatedness metrics, we provide the first large-scale empirical evaluation of these competing hypotheses.
3 Methodology and data sources
To examine the path dependence of diversification, our empirical analysis proceeds in two steps. First, we unpack co-export patterns to assess whether the observed co-location of industries across countries is better explained by input–output linkages, occupational or technological similarities, or other forms of relatedness. This allows us to identify which productive factors account for the tendency of industries to appear together or co-locate.
Second, we test whether the presence of related industries –summarized through density metrics– predicts the subsequent entry or exit of industries. This step directly evaluates whether diversification follows a beneficiation-driven trajectory, in which downstream sectors emerge around existing upstream industries, or whether it is instead shaped by knowledge-based capabilities already embedded in the economy.
3.1 Unpacking co-location
We begin by decomposing the drivers of export co-location. This analysis provides initial evidence on whether the observed patterns of co-presence among industry pairs are driven by input-output linkages –specifically forward linkages, consistent with the logic of beneficiation– or by other factors. We unpack the export co-location metric, which has been used in the literature as a proxy for both value-chain linkages (Hausmann, Klinger and Lawrence, 2008) and know-how relatedness (Hidalgo et al., 2007), to better understand its underlying determinants.
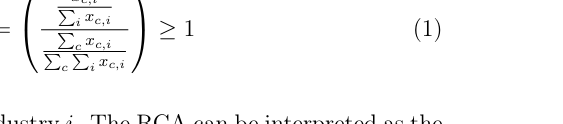
To calculate co-exporting, we begin by first defining whether an industry is present in a country using a traditional measure of revealed comparative advantage (RCA, after Balassa (1965)) following a standard practice in the literature:

where x c,i denote the exports of country c in industry i . The RCA can be interpreted as the relative importance of an industry in a country’s export basket (the numerator), compared to the industry’s share in global trade (the denominator). A country is considered to have specialized in an industry and achieved comparative advantage (or competitive presence)
when the RCA is equal or greater than one. Accordingly, we define the binary variable M c,i which takes the value of one if industry i has RCA equal or larger than one in country c , and zero otherwise. 20 Then, we calculate the pairwise matrix of co-exporting as X 1 N C i,j = P ( i | j ) = 20 In addition, to eliminate spurious cases of industry presence –particularly in smaller countries– we apply a minimum export-value threshold: an industry is considered present only if its export value exceeds US$10 million. This condition is binding in fewer than 1% of observations in the full sample.

M c,i = 1
C i,j measures the likelihood of observing competitive presence in industry i conditional on having presence in industry j . Importantly, we define this variable differently from previous studies (Hidalgo et al., 2007; Hausmann, Klinger and Lawrence, 2008), specifically using an asymmetric definition or proximity as our objective is to test the directionality of the relationship between industries (for example, whether downstream industries such as petrochemicals ( i ) tend to emerge when upstream sectors like petroleum gases ( j ) are already present). 21 As a result, the computed matrix is not symmetric: the likelihood of observing industry i given industry j is present differs from the likelihood of observing j given i . Due to the use of industry-level characteristics –described in detail below– we restrict our analysis to 233 tradable industries, resulting in a co-exporting matrix with 233 ⇥ 232 = 54 , 056 observations.
We explore the drivers of co-exporting estimating the following type of regressions by OLS,

where C c,i is the pattern of co-exporting of industries i, j ; ‘ c,i represent various measures of relatedness between industries – such as the extent to which industry i uses inputs sourced from industry j , or the similarity in the occupational composition of their workforces. In the regression we control for industry fixed effects, represented by λ i and λ j , to control for the differential prevalence of industries in the data. We estimate variations of this regression to test whether there is a statistically significant relationship between the relatedness measures and co-exporting patterns. A significant and positive coefficient on the relatedness measure ( β ) would indicate that greater similarity or linkage between industries is 21 Proximity from co-exports –referred to as proximity in Hidalgo et al. (2007)– are calculated as the minimum of P ( i | j ) and P ( j | i ) , where each term represents the conditional probability of observing one product given the presence of another. The minimum is used to eliminate spurious associations and retain only those pairs of products or industries that are consistently and strongly found together in the data. As a result, their co-location measure is symmetric, a feature that suits their descriptive analysis but is less appropriate for our empirical goal, which focuses on directional relationships between industries.
associated with a higher likelihood of co-exporting. As an extension, we estimate specifications that include multiple relatedness matrices simultaneously. Since these measures are often correlated, this approach allows us to test competing explanations for co-location – such as whether observed patterns are better explained by input-output linkages, occupational similarity, or technological proximity – while controlling for the influence of the other channels. 22 To test competing explanations, we construct several measures capturing different relatedness dimensions between industries. The beneficiation narrative implies a directional relationship between existing industries and the emergence of downstream industries. To capture this, we compute the share of inputs used in industry i that are sourced from industry j , using highly disaggregated U.S. Input-Output tables. This measure reflects actual market flows of intermediate goods and services and provides a strong interpretation of value-chain linkages, though it requires detailed information on input purchases between industries.
As a less restrictive and non-directional alternative, we also compute the similarity of input use between pairs of industries – i.e., the extent to which industries rely on a similar basket of inputs. We measure similarity of inputs shares using correlation. This measure allows us to identify relatedness even when direct flows are not observed, and it is particularly useful when linkages arise through shared production factors rather than explicit supply chains. We further disaggregate this measure by distinguishing between tradable and non-tradable inputs (e.g., domestic services), which provides insight into whether co-location and diversification patterns are driven by globally sourced or locally embedded inputs.
22 Our empirical strategy is conceptually related to Ellison, Glaeser and Kerr (2010) and the follow-up paper by Diodato, Neffke and O’Clery (2018), which study co-agglomeration among U.S. manufacturing industries. A key difference is the outcome: we analyze co-exporting across countries rather than geographic co-location. Their findings support a Marshallian view—input sharing, labor-market pooling, and knowledge spillovers reduce the costs of moving goods, people, and ideas. We extend this framework to the international context, testing whether Marshallian-type relatedness or technological/occupational proximity better explains co-export patterns and industry entry/exit. While Marshallian forces are typically local, we interpret our measures as shared capabilities that operate beyond place.
To test explanations beyond direct input-output linkages – focusing instead on knowledgebased relatedness – we rely on two complementary measures. First, we compute the similarity in the occupational structure of industries, capturing the extent to which industries employ similar types of workers. 23 We measure occupational relatedness as the Pearson correlation of industry-level occupation share vectors, capturing proximity in workforce composition. The intuition behind this measure is that industries intensive in similar occupations (e.g., engineers, technicians) are more likely to co-occur. To analyze heterogeneity, we compute separate correlations for high- and low-skill occupations (as defined above).
Second, we measure technological proximity using similarity in industries’ patentcitation profiles. Industries drawing on comparable knowledge bases tend to co-occur, reflecting shared innovation capacity. Together with the occupational metric, this captures the roles of human capital and technology in productive diversification.
3.2 Density in the industry space
To test whether diversification builds on pre-existing capabilities in a location, we construct a measure of the density of related industries for each country-industry pair. The empirical question is whether a new industry is more likely to emerge when industries related to it –according to the competitive hypothesis– are already present at baseline with sufficient intensity, which we define as RCA ≥ 1 . In other words, we examine whether the strength of related capabilities embedded in a country’s existing industrial structure increases the likelihood of subsequent industry entry.
23 An ideal, directional measure of knowledge in diversification would track worker flows between industries, revealing skill transferability and the direction of capability diffusion. Such data are unavailable for the United States at the NAICS detail we require: the CPS tracks labor flows but its sample size is too small to identify inter-industry transitions at this granularity, and data for other countries use non-comparable classifications. We therefore rely on non-directional proxies—most notably occupational similarity—to capture knowledge-based relatedness across industries.
For each country-industry pair, we compute a density as:
P Density c,i = (4)
where ‘ i,j is any of the relatedness matrix between industries pairs we explained previously (e.g. share of inputs that i uses from j ), and M i,j is an indicator of whether other “ j ” industry is present in country c with the value of one if RCA ≥ 1 , and zero otherwise.
The numerator captures the weighted presence of related industries in each country, while the denominator normalizes this by the total potential relatedness. Given the units of relatedness measures and industry presence, the measure lies between zero and one. Note that in (4), the summation is taken over the set of K industries j that are most closely related to a given industry i in the relatedness matrix ‘ i,j . The rationale for restricting the summation to a subset K is to reduce noise and emphasize the most meaningful linkages.
In this setting, we set K = 60 , selecting the 60 industries most closely related to each industry i based on the chosen relatedness metric. 24 In the robustness section, we show that our results remain stable across a range of alternative values of K .
An important feature of our empirical strategy is that the relatedness metrics ‘ i,j are fixed over time and measured for a single reference period. This is straightforward for relatedness measures based on input–output linkages (from the U.S. BEA tables) or occupational similarity (from the U.S. BLS OES data), which are available for specific years and reflect relatively stable structural characteristics. However, this approach differs from other studies in the literature that allow relatedness to vary over time, often recalculating co-export or capability proximity measures using moving windows. By holding ‘ i,j constant, we isolate the source of temporal variation in the density Variables to changes in the N . With N=232 industries, this implies K ⇡ 15 , which is small in absolute terms given the dataset’s sparsity (on average, only 20% of industries are present per country). We therefore set K = 60 ⇡ (4 p N ) to capture broader spillovers from related industries while preserving signal. This broader set allows us to capture a richer picture of potential spillovers from related industries while preserving the strength of the signal in the density measure.
presence of related industries. This design choice emphasizes the role of evolving industrial structure –rather than fluctuating definitions of relatedness– in shaping diversification dynamics and allows for a cleaner interpretation of the predictive power of capabilities at baseline.
Relatedness measures such as co-location and density have been interpreted in different ways across the literature. Hausmann, Klinger and Lawrence (2008) viewed density as a proxy for unobserved capabilities shared across industries, while Ellison, Glaeser and Kerr (2010) emphasized Marshallian externalities such as input sharing, labor pooling, and knowledge spillovers. More recent contributions (Bahar et al., 2019; Diodato, Neffke and O’Clery, 2018) further unpack the mechanisms behind co-agglomeration, highlighting cross-sectoral knowledge flows. Building on these perspectives, our empirical strategy decomposes density into distinct drivers –input-output linkages, occupational similarity, and technological proximity– rather than treating it as a black box.
To build intuition for the density measure, Figure 1 presents a toy example centered on the petrochemical industry, with K = 5 for simplicity. The left panel displays a table listing the top five industries most closely related to petrochemicals, sorted by their colocation scores in column 4. The table also includes an indicator variable showing whether each related industry is present in the country (column 5). The right panel presents a network visualization: the target industry (petrochemicals) is shown at the center in orange, surrounded by the five related industries. These are colored green if present in the country ( RCA ≥ 1 ) and red if absent ( RCA < 1 , “Fertilizer manufacturing” and “Petroleum refineries in the example”). The links connecting them to petrochemicals represent the strength of the relatedness measure, with thicker lines indicating higher weights.
[Figure 1 about here.] In the example shown in figure 1 –following the density equation shown in (4)– we compute the density around petrochemicals by multiplying each relatedness value (column 4) by the corresponding industry presence indicator (column 5). Summing the results and
then dividing by the sum of the relatedness values yields:
Density = 0 . 791 + 0 . 551 + 0 . 550 + 0 . 521 + 0 . 520 0 . 79 + 0 . 55 + 0 . 55 + 0 . 52 + 0 . 52 = 1 . 86 2 . 93 = 0 . 63 This value reflects the share of total relatedness accounted for by industries already present, indicating –in this example– a moderate level of embedded capabilities around petrochemicals. 25 The hypothesis is that a higher density of related industries indicates the presence of the capabilities required to competitively host a given industry in a specific location.
We define industry entry in a similar way as to how we have defined entry as

In words, we define industry entry as the transition from a low relative position in world markets –a revealed comparative advantage below of 0.25 or less– to a meaningful level of competitive presence captured by RCA of 1 or above. 26 While the 0.25 threshold is somewhat arbitrary, it is chosen to exclude industries that already had a non-negligible export share and instead focus instead on those that were initially marginal in a country’s export basket. The intuition is to detect cases of genuine emergence of exports: crossing this line implies at least a fourfold increase in relative specialization. 27 Our focus on the extensive margin follows the policy discourse—especially national plans advocating beneficiation. These strategies aim not to deepen existing specializations but to foster the emergence of new, higher–value-added activities that build on naturalresource or agricultural bases while creating novel capabilities. Accordingly, tracking in-
dustry entry provides an empirical counterpart to the stated goal of moving from raw extraction into downstream processing, manufacturing, and globally competitive value chains.
To test the predictive power of density, calculated using various relatedness measures, we estimate regressions of the following form:

where the dependent variable Entry c,i,t +5 is an indicator for whether industry i entries in country c five years after the baseline year t . 28 The key explanatory variable is Density c,i,t , capturing the extent of related industries present at baseline. 29 In the results section, we present regression estimates using density measures constructed from different relatedness metrics to assess the robustness of our findings across alternative definitions of industry relatedness. To control for demand-side factors, we control for (log) market access for each country–industry pair, computed as the sum of industry-level imports across all destination countries, weighted by the inverse of the geodesic distance from country c to each destination. This measure is intended to capture the potential external demand a country faces for each industry, adjusted for trade frictions due to geographic distance. We include controls for the initial revealed comparative advantage RCA c,i,t , as well as country-year fixed effects λ c,t and industry-year fixed effects λ i,t . The country-year fixed effects absorb timevarying country-level factors that could influence diversification across all industries—such as openness, macroeconomic conditions, or national policy shifts—thus isolating the effect of relatedness and market access on entry and exit dynamics. 30 28 In the entry regressions, we exclude country–industry pairs with initial RCA > 0 . 25 so that observed entries reflect substantive transitions rather than marginal, short-term fluctuations in competitiveness.
29 Previous studies have examined the predictive power of density on industry entry and exit patterns using similar empirical strategies. Some examples include Bahar et al. (2019) and Bustos and Yildirim (2022). Our approach is particularly related to that of Bahar et al. (2019), who compute density using multiple relatedness matrices and find broadly consistent results regarding the role of related capabilities in shaping diversification. However, unlike these studies, our analysis places specific emphasis on testing the explanatory power of beneficiation-related linkages relative to knowledge-based channels.
We test whether capabilities diffuse through related industries by examining the sign of the density coefficient, β 1 . For entry regressions, we restrict the sample to country-industry pairs absent at baseline and expect β 1 > 0 , i.e., a denser presence of related industries raises the probability of entry. When exploring industry exit, we replace the dependent variable in (6) with a variable defined as RCA < 0 . 25 (similar to (5)), restrict to pairs present at baseline, and expect β 1 < 0 , implying that greater related density lowers the likelihood of losing competitive status.
3.3 Data
To implement the methodology of our empirical analysis and test patterns of diversification, we draw on datasets from multiple sources. These include detailed export data, inputoutput tables at the industry-level, occupational structures, and patent citations. We describe the data sources below, as well as how variables are constructed, and provide summary statistics to describe the sample used in the analysis.
Following prior studies, we restrict the sample to countries with at least 1 million people and total trade of at least US$1 billion (in 2015) to reduce noise and ensure that exports reflect underlying capabilities (Hausmann et al., 2014; Bahar et al., 2019; Bustos and Yildirim, 2022). These filters yield 134 countries, for which we construct annual sector-by-country exports to the rest of the world; the sample covers over 90% of world trade.
• Trade data. We use international trade data from UN COMTRADE, accessed through the cleaned and harmonized version maintained by Harvard’s Growth Lab for the Atlas of Economic Complexity. The dataset provides annual export values low initial RCA and removes those that experience entry, producing a highly unbalanced panel in which many country-industry pairs appear only once. When entry occurs, the unit typically drops out thereafter (unless a later exit is observed), creating numerous singletons. Country-industry effects would absorb these observations and eliminate much of the identifying variation, sharply reducing the effective sample and power.
by product, classified under HS 1992, for all countries from 1995 to 2022. 31 Using concordance tables, we map HS codes to NAICS industries to enable industry-level analysis. The resulting dataset is used to measure exports for 233 NAICS-industries.
• Upstream and similar industries. We capture input–output relationships using the 2012 Input–Output tables from the U.S. Bureau of Economic Analysis. First, for each industry pair ( i, j ), we calculate the share of inputs that industry i sources directly from upstream industry j . Second, we compute input-similarity measures by correlating the full vectors of input shares across all industry pairs. We further split this similarity into non-tradable and tradable components.
• Occupation similarity. We measure occupational similarity using the BLS Occupational Employment and Wage Statistics (OES). For each industry, we construct a vector of occupation employment shares from employment-weighted occupation– industry cells, averaged over 2015–2020. Similarity between industries is the Pearson correlation of these vectors. To examine skill intensity, we compute separate correlations for highand low-skill occupations, defined by whether an occupation’s average wage is above or below the national median.
• Technology similarity . We proxy technology similarity across industries using patent citation data from the NBER Patent Data Project (Hall, Jaffe and Trajtenberg, 2001), which is based on U.S. patent records from 1976 to 2006. Specifically, we use measures of inter-industry patent citations to assess the degree to which industries rely on similar technological knowledge. The intuition is that higher citation overlap between industries indicates greater technological proximity between industries.
• Market Access. We measure country–industry market access as MA c,i = P 31 Our analysis begins in 1995, the first year for which detailed and accurate trade data and a consistent HS–NAICS mapping are available. We adopt NAICS to leverage complementary datasets –specifically the U.S. input–output tables and occupational statistics– that enable industry-level measures of linkages and workforce composition.
i.e., destination imports in industry i weighted by inverse bilateral distance (implying a distance elasticity of − 1 , in line with estimates found in the trade literature). Trade data are from the Atlas of Economic Complexity; population–weighted distances are from CEPII’s GeoDist (Conte et al., 2022).
Table 1 reports descriptive statistics for the co-location measure C i,j and the related-
ness metrics ‘ i,j used to unpack co-export patterns. C i,j is the conditional probability of competitive presence in industry i given industry j , while ‘ i,j spans input–output linkages, occupational similarity, and technological proximity (see previous section). We restrict to 233 tradable industries with complete data, yielding a directed matrix of 233 ⇥ 232 = 54 , 056 industry pairs for the empirical analysis.
[Table 1 about here.]
Table 2 presents descriptive statistics for industry presence, entry, and exit, based on
five-year cross-sections constructed from 1995 to 2020. Panel A reports summary statistics for the full sample of country–industry observations. Panels B and C restrict the data to the subsamples used in the entry and exit analyses, respectively. Panel B includes only those industry–country pairs where the industry was not present at baseline (i.e., eligible for entry), while Panel C includes only those where the industry was present at baseline (i.e., at risk of exit), as described in the methodology section.
[Table 2 about here.]
4 Results
4.1 Decomposing co-location of exports
Table 3 reports OLS estimates from equation (3), relating co-exporting patterns to alter-
native relatedness measures. We first enter each metric separately to compare explanatory
power. Column 1 includes as the sole regressor the share of inputs sourced from the upstream industry. Column 1 reports estimates using the share of inputs sourced from the upstream industry as the independent variable. The results indicate that a one standard deviation increase in upstream input share is associated with a 1.3 percentage point increase in the likelihood of observing competitive presence in the downstream industry. Column 2 reports results controlling for the similarity in the inputs used by each pair of industries.
We find that a one standard deviation increase in input similarity is associated with a 4.5 percentage point increase in the likelihood of observing the presence of other industries that use similar intermediate inputs. In Column 3, we decompose input similarity into two components: similarity in tradable inputs and similarity in non-tradable inputs. Both components exhibit explanatory power, with point estimates of 3.7% for tradables and 2.6% for non-tradables, suggesting a slightly stronger effect for tradable input similarity.
[Table 3 about here.] Next, we examine whether the co-location of industry pairs is driven by similarity in knowledge-based capabilities, proxied by either occupational structure or patent citations.
Column 4 reports that a one standard deviation increase in occupational similarity is associated with a 6.2 percentage point increase in the likelihood of co-exporting. In Column 5, we further disaggregate occupations into high-skill and low-skill categories. The results suggest that high-skill occupational similarity is a stronger predictor of co-exporting, with coefficients of 4.5% and 3.7% for high- and low-skill occupations, respectively. Finally, Column 6 shows that a one standard deviation increase in patent citation similarity is associated with a 1.5 percentage point increase in the probability of joint industry presence.
The final two columns of Table 3 present specifications that directly compare the explanatory power of input-output linkages and knowledge-based relatedness. Column 7 includes multiple Variables simultaneously and shows that, while all coefficients remain statistically significant, those associated with input-output linkages decline substantially
in magnitude relative to earlier specifications. In contrast, occupational similarity continues to exhibit strong explanatory power, with a one standard deviation increase associated with a 4.8 percentage point increase in the probability of joint industry presence. Column 8 presents a similar specification, this time disaggregating input similarity into tradable and non-tradable components, and occupational similarity into high and low-skill categories.
The results are consistent: input-based measures have relatively smaller coefficients, while both high- and low-skill occupational similarities remain strong predictors of co-location.
Interestingly, in Column 7, the coefficient on patent citation similarity is no longer statistically significant, suggesting that its explanatory power diminishes once other factors –particularly occupational similarity– are accounted for.
Our interpretation of Table 3 is that while input-output linkages do explain some of the co-location patterns among industries, knowledge-based measures – particularly occupational similarity – are consistently stronger predictors of joint industry presence. This suggests that the transmission of know-how and human capital plays a more central role than supply-chain connections in shaping patterns of productive diversification. The explanatory power of patent citation similarity is weaker and becomes statistically insignificant when controlling for other factors.
Table 4 presents an additional analysis focused on natural resource–related (NNRR) in-
dustries to examine whether the patterns of diversification differ in these sectors. 32 Specifically, we restrict the sample to cases where an NNRR industry is present and examine which factors predict the presence of other industries. It is noteworthy that restricting the analysis to the presence of NNRR industries reduces the sample size to 1,856 observations.
32 We define natural resource industries based on the following eight NAICS codes: 211000 (Oil and gas extraction), 212100 (Coal mining), 212230 (Copper, nickel, lead, and zinc mining), 2122A0 (Iron, gold, silver, and other metal ore mining), 212310 (Stone mining and quarrying), 2123A0 (Other nonmetallic mineral mining and quarrying), 324110 (Petroleum refineries), and 325110 (Petrochemical manufacturing). We chose a more inclusive approach in defining the oil sector by incorporating multiple codes (211000, 324110, and 325110), given the ambiguous boundary of what constitutes an upstream natural resource in this context. Unlike commodity trade classifications (e.g., the Harmonized System), which offer greater specificity for natural resources (NNRR) products, industry classifications tend to be more aggregated, particularly for mining.
Accordingly, the analysis estimates the probability of exporting a given industry conditional on the presence of NNRR industries. The structure of the table mirrors that of Table 3.
The results indicate that only occupational similarity – particularly in high-skill occupations – has explanatory power for co-export patterns. All other Variables are statistically indistinguishable from zero. Notably, the lack of significance for input-output linkages suggests that, on average, there is no clear pattern indicating that industries which heavily utilize natural resources tend to co-occur with NNRR industries in a consistent manner.
[Table 4 about here.] Taken together, Tables 3 and 4 show that natural resource presence has limited explanatory power relative to knowledge-based linkages. We now turn to a complementary approach, examining how diversification unfolds by analyzing the entry and exit of industries and how it relates to the set of industries present at baseline in the country.
4.2 Diversification patterns
Table 5 presents the results on industry export entry and exit. The table is divided into
two panels: Columns 1 to 4 report estimates for industry entry, while Columns 5 to 8 report estimates for industry exit. The coefficients indicate whether baseline conditions are correlated with subsequent patterns of entry or exit. All specifications are estimated using linear probability models (LPM) via OLS, including year-country and year-industry fixed effects, with standard errors clustered two-way by country and industry, and all variables are normalized to have mean of zero and standard deviation of one. Specifications control for market access at the country-industry level –as a proxy for demand-side conditions– and include bins of revealed comparative advantage (RCA) interacted with year to flexibly account for the initial export intensity of industries at baseline. 33 For reference, the unconditional probability of entry is approximately 2%, which provides a useful benchmark for 33 For brevity, coefficients on the RCA bins are omitted. They are, on average, positive in the entry models and negative in the exit models: industries with higher initial RCA are more likely to enter and less likely to exit, consistent with the relatively high threshold we use to declare presence.
interpreting the magnitude of the estimated coefficients. Column 1 reports estimates using density calculated using proximity of industry co-location, a measure well established in the literature, serving as a benchmark. The results indicate that increasing density using the proximity of co-location is associated with a 1.2% percentage point increase in the likelihood of industry entry to exporting (or equivalent to 60% of the unconditional probability of entry). In Column 2, we use density metrics computed based on the share of inputs from upstream industries to assess whether the presence of related upstream sectors is associated with entry. The estimate suggests that a one standard deviation increase in this input-based density increases the likelihood of entry by 0.198 percentage points (or 10% of the unconditional probability of entry). In Column 3, we test competing hypotheses by including densities based on input similarity, occupational similarity, and patent citations. Once these alternative measures are introduced, the coefficient on input-based density becomes statistically insignificant, reversing the conclusion from Column 2. The density based on input similarity yields a coefficient of 0.325 (17%), indicating a weaker association with entry compared to occupational similarity. The largest effect in Column 3 comes from occupational similarity, with a coefficient of 0.569 (28%), highlighting the stronger role of occupation-knowledge-related linkages in predicting industry entry. Interestingly, the density measure based on patent–citation similarity has only a modest effect and is not statistically significant at conventional levels.
In Column 4, we refine the analysis by disaggregating input and occupational similarities. Specifically, we split input similarity into tradable and non-tradable components and occupational similarity into high- and low-skill occupations, following the approach used in the previous section. The results suggest that the explanatory power is concentrated in densities computed using occupations, while the coefficients for tradable and non-tradable inputs and are statistically indistinguishable from zero. Both high- and low-skill occupational densities are significant predictors of entry (coefficients 0.37 and 0.41), highlighting the role of knowledge-based linkages. By contrast, patent-citation similarity is not sta-
tistically different from zero. Overall, the results suggest that entry into new industries is largely driven by the availability of local knowledge capabilities rather than by direct input-output linkages to upstream industries.
[Table 5 about here.] Columns 5 to 8 present estimates for industry exit from competitive exports, following in the table the same structure as the entry regressions shown in Columns 1 to 4. Before turning to the coefficients, note that model fit –as measured by the R-squared– is almost twice as high for the exit specifications compared to the entry ones. This suggests that the empirical approach is more effective at predicting which industries are unlikely to persist in a given location than at identifying which new industries are likely to emerge.
The unconditional probability of industry exit is approximately 5%, providing a useful benchmark for evaluating the magnitude of the estimated effects. Column 5 reports results using density based on export co-location, yielding a coefficient of –1.7 (or 34% of the unconditional probability). This indicates that industries surrounded by others with which they tend to co-occur are significantly less likely to exit. Column 6 includes density based on the presence of upstream inputs but finds no statistically significant effect. In Column 7, we expand the specification to include additional relatedness measures – input similarity, occupational similarity, and patent citation similarity. The results show that densities based on input, occupation and patent similarity are strong predictors of lower likelihood of industry exit. In Column 8, we further disaggregate the relatedness measures, incorporating densities based on input similarity (tradable vs. non-tradable) and occupational similarity (high- vs. low-skill). First, when we split input similarity into its tradable and non-tradable components, both coefficients are negative but statistically insignificant; relative to column 7, this decomposition appears to dilute explanatory power.
Second, only the density based on low-skill occupational similarity remains a significant predictor of industry persistence, whereas the coefficient for high-skill occupational similarity is statistically indistinguishable from zero. Industry persistence is more closely tied
to the density of low-skill occupations, while high-skill density does not appear to matter.
By contrast, patent-citation similarity has a negative, statistically significant coefficient, indicating that industries with related technological capabilities are more likely to survive.
The results suggest that Knowledge-based linkages—occupational similarity and shared technological capabilities—are stronger predictors of industry persistence than input–output linkages. When upstream-input similarity is split into tradable and non-tradable components, both coefficients are near zero ((compare columns 3–4 and 7–8)), unlike the specification using the full input set. By contrast, similarity in non-tradable inputs and high-skill occupational density significantly lowers exit risk. The specifications also predict exits better than entries, making them useful for flagging structural weaknesses in competitiveness.
Market access helps predict entry but not exit. Overall, locally embedded capabilities and human capital dominate in shaping patterns of industrial activity.
4.3 The export intensive margin
While beneficiation policies are primarily concerned with fostering the emergence of new industries –justifying our focus on the extensive margin of trade through the analysis of industry entry and exit– it is also informative to extend the empirical analysis to the intensive margin of exports. Specifically, we examine whether export volumes in year t + 5 are influenced by the baseline conditions captured by our different density measures.
Given the prevalence of zero trade flows in the data, we apply Poisson pseudo-maximum likelihood (PPML) estimation with high-dimensional fixed effects, a method well-suited for dealing with sparse trade matrices (Weidner and Zylkin, 2021). In this specification, we add country-industry fixed effects to the country–year and industry–year effects used above. These absorb time-invariant heterogeneity at the country–industry level (e.g., intrinsic comparative advantage, endowment-driven specialization), thereby controlling for mechanisms of the form (industry intensity) ⇥ (country endowment) in the Heckscher–
Ohlin tradition and in empirical work such as Romalis (2004) and Nunn (2007). 34 Finally, we control for RCA of the exports at baseline. This setup allows us to isolate the role of relatedness-based density in shaping the growth of existing exports, beyond what can be explained by structural fundamentals arising from factors and endowments.
Table 6 presents the results for the extensive margin of exports, using the same spec-
ification structure as in previous tables. All density Variables are standardized to have a mean of zero and a standard deviation of one, allowing for a direct comparison of effect sizes across Variables . In column 1, we report that density based on co-location is a strong and statistically significant predictor of export growth. Column 2 introduces density based on the share of upstream industries (our proxy for the beneficiation channel), which shows a positive association with export growth. However, its significance vanishes in column 3 once we control for alternative density measures capturing capability-based explanations.
Notably, in column (3), we estimate that a one standard deviation increase in the density of similar occupations is associated with a 10% increase in export growth. The estimates of column 4 further disaggregate the upstream similarity and occupational similarity measure by skill level, revealing that the growth effect is primarily driven by the presence of industries employing similar low-skill occupations.
[Table 6 about here.]
4.4 Diversification patterns: robustness checks
To assess the robustness of our findings, this section explores three complementary exercises. First, we restrict the analysis to resource-rich countries to examine whether patterns of diversification differ in contexts where natural resources are more relevant in shaping 34 It is worth noting that, in this setting, detecting statistically significant coefficients is inherently challenging due to the inclusion of high-dimensional fixed effects (country-year, industry-year and countryindustry). These fixed effects absorb much of the variation, especially in the presence of slow-moving factors such as productive capabilities, which tend to accumulate gradually over time. As a result, the remaining variation available for identification is limited, making the observed significant associations more robust and informative.
the industrial landscape, and where in theory beneficiation strategies are most relevant.
Second, we test the sensitivity of our results to the choice of the number of related industries used to compute density (i.e., the parameter k in our density measures). Finally, we evaluate the predictive power of our empirical approach across alternative time horizons, comparing industry entry and exit dynamics over 3, 5, 8, and 10 years. These checks help ensure that our conclusions are robust and not driven by arbitrary choices.
Table 7 explores whether the patterns observed in previous analyses is similar of dif-
ferent for natural resource–rich countries, defined as those where primary commodities account for more than 70% of exports. The structure of the table mirrors that of Table 5.
For brevity, we focus on the most relevant and unexpected findings. Regarding industry entry, we find that density based on upstream industries does not exhibit predictive power.
In other words, within this subsample of resource-rich countries, there is no evidence that new industries systematically emerge by leveraging the presence of upstream sectors from which they might source inputs. However, we do find strong evidence that diversification in these countries continues to rely on knowledge-based linkages, particularly those associated with occupational similarity. In Column 3, the coefficient on density based on occupational similarity is 0.4, while Column 4 – where this measure is disaggregated into high- and low-skill components – shows that the effect is largely driven by high-skill occupations, with a coefficient of 0.37. Interestingly, and in contrast to the estimates based on the full sample, Table 7 shows that the effect of market access is statistically indistinguishable from zero. These results suggest that, in resource-rich economies, diversification is not primarily driven by demand-side (market-pull) forces. Instead, such countries diversify much like others do, contrary to beneficiation theories.
[Table 7 about here.] Next, we turn to the estimates of industry exit presented in Table 7. Notably, we find little support for explanations based on input-related linkages: none of the measures capturing the presence of related inputs are statistically significant. The only variable with
predictive power at the 5% confidence level appears in Column 8, where the density of industries that use similar high-skill occupations is associated with a lower probability of exit. Industries less proximate to high-skill occupational capabilities are more likely to lose competitiveness and exit within five years. This reinforces that knowledge-based linkages –especially those tied to high-skill labor– are central to sustaining industry presence, including in resource-rich settings.
The findings from Table 7 suggest that, in natural resource–rich countries, diversification is not driven by traditional input-output linkages or demand-side (market access)
factors. Instead, the emergence and persistence of new industries appear to rely heavily on knowledge-based linkages – particularly those associated with high-skill occupations. The weak effects of upstream-input density and market access suggest that structural transformation in these economies depends less on resource linkages or external demand and more on specialized human capital. Policy should prioritize investments in skills and knowledge systems even in commodity-dependent settings to support sustainable and resilient diversification.
Table 8 presents a robustness check using alternative values for parameter k in the
density calculation – i.e., the number K-nearest neighbor-industries considered “related” to a given target industry. This exercise tests whether the estimates are sensitive to the choice of k, and whether our conclusions hold. Panel A show estimates for industry entry, while Panel B show estimates for exit, both following the baseline specification used in Column 3 and 7 of Table 5. Both panels contain 10 columns, corresponding to values of k ranging from 15 to 150, increasing in increments of 15. Column 4, where k = 60 , corresponds to the specification used in the main text of the paper. The results show that the estimated coefficients remain stable and statistically significant across different values of k for most relatedness measures highlighted previously demonstrating the robustness of the findings.
Notably, the density based on the share of upstream inputs –a proxy for the beneficiation channel– is never statistically significant for any k . This reinforces that forward linkages
captured by input shares have limited explanatory power for industry dynamics.
In panel B, where we show estimates for industry exit, we find something different; density calculated similar upstream inputs is a stitistically strong predictor a values of k equal or smaller than 75, while the density of similar occupations becomes statistically significant starting at k = 45 By contrast, when we estimate specification for density using similarity in upstream inputs, the results vary with k . In Panel A, for industry entry, the coefficient is insignificant at low levels of k (i.e., when considering a small set of neighboring industries), but becomes statistically significant at k = 45 and remains so for larger k . Over the entire range of k , the density of similar occupations remains a strong explanatory variable. In Panel B, for industry exit, the density based on similar upstream inputs is a statistically strong predictor for k • 75 , whereas the density of similar occupations becomes statistically significant starting at k = 45 .
What value of k maximizes the explanatory power of the density measures? We assess each specification’s fit using the root mean squared error (RMSE) and the log-likelihood, benchmarking them against the best-fitting model across all values of k . For brevity, the table notes report the absolute RMSE and log-likelihood for the best specification, while each column reports the difference relative to that benchmark ( ⇥ 1000 ). The results indicate that the best fit for industry entry is achieved at k = 60 (the value used in the main results), whereas the best fit for exit is at k = 135 . Thus, selecting k by maximizing explanatory power would leave our substantive results and conclusions unchanged.
[Table 8 about here.]
Table 9 presents estimates using four different time horizons –3, 5, 8, and 10 years–
based on the baseline specifications used in Column 3 (for entry) and Column 7 (for exit) of
Table 5. This robustness check assesses whether the predictive power of density measures
–and our conclusions– vary with the time window considered. Across all time horizons, variables based on similarity in inputs and in workforce occupations—particularly those
reflecting knowledge-based capabilities—are consistently statistically significant predictors of industry entry. For industry exit –while occupational-density remains a strong predictor across horizons– we find that similarity in upstream inputs and patent-citation similarity are significant predictors of reduced exit (i.e., greater survival) at the 5-year horizon, but not at longer horizons.
Interestingly, model fit for entry –as measured by R 2 – improves with longer time horizons, whereas for industry exits the fit deteriorates, making exits harder to predict. This pattern suggests that capability diffusion and industry emergence unfold over extended periods, emphasizing the role of structural, knowledge-based factors in shaping diversification trajectories.
[Table 9 about here.]
5 Concluding remarks
This paper has examined the relative importance of value-chain linkages versus knowledgebased capabilities in shaping patterns of productive diversification. By unpacking export co-location and tracking export’s entry and exit of industries across countries, we provide robust evidence that diversification is far more consistently explained by occupational similarity and knowledge-based linkages to existing industries than by forward linkages to upstream resource sectors.
Density metrics based on the share of upstream inputs have little explanatory power for diversification; any weak associations disappear once other relatedness measures are included. The pattern is even sharper in resource-rich economies: high-skill occupational similarity remains significant for entry and reduces exit risk, whereas input–output densities are insignificant and unstable in sign. Overall, the evidence favors capability redeployment over beneficiation—new industries emerge from recombining existing know-how.
High-skill occupational structure is the most robust predictor of both industry emergence
and survival.
The strength of our argument lies in the consistency of the results: across multiple specifications, samples, and robustness checks, input-output linkages display little to no explanatory power once capability-based metrics are accounted for. These findings contrast sharply with the persistence of beneficiation as a centerpiece of national development strategies, especially in Sub-Saharan Africa and other resource-rich regions. While policy blueprints often assume that structural transformation can be engineered by “adding value” to raw materials or commodities, the empirical record shows no evidence in support of beneficiation as a reliable path to sustained diversification.
A noteworthy implication of our results is that diversification at the extensive margin (Table 5) is most strongly associated with the local density of similar occupations –both high- and low-skill– whereas diversification at the intensive margin (Table 6) is primarily driven by densities based on low-skill occupational similarity. One plausible mechanism is that entry into new exporting industries has a high fixed–capability threshold: it requires a dense presence of complementary workers. Hence extensive-margin diversification correlates with both high- and low-skill occupational density. By contrast, once those lumpy, high-skill fixed inputs are in place, scaling within existing industries relies more on margins that are intensive low skilled labor; the binding constraint shifts to the availability of compatible low-skill (and technician) occupations, making low-skill proximity a stronger predictor of the intensive margin.
Our contribution is twofold. First, we provide a systematic empirical comparison of competing hypotheses –something largely absent from the literature– thereby helping reconcile why beneficiation remains politically attractive despite limited evidence of success. Second, we highlight that successful diversification rests on strengthening knowledge ecosystems: building occupational capabilities, supporting innovation, and fostering institutional environments that make more sophisticated industries viable.
From a policy perspective, our findings suggest the need to rethink industrial strate-
gies. This is striking considering the long-standing policy bias toward the beneficiation hypothesis, which has for decades driven mandates for downstream processing of natural resources. Instead, governments should prioritize the deliberate accumulation of productive capabilities; investing in specialized technical skills and designing frameworks that enable knowledge and know-how to spill over across sectors. Diversification policies should therefore target more complex industries, capable of sustaining higher wages, that are adjacent to a country’s existing productive base in terms of non-tradable skills.
Our analysis has some limitations. It focuses on export patterns, which capture only part of the diversification process, and relies on relatedness measures for inputs and occupations derived largely from US. data. Future research could expand the analysis by incorporating domestic production linkages, firm-level dynamics, and the political economy of why beneficiation persists in policy discourse despite its weak empirical foundations.
By opening this agenda, we hope to inspire further work that bridges empirical analysis with the design of more realistic industrial policies.
In conclusion, the evidence suggests that productive transformation is less about extracting more value from what countries have, and more about cultivating the knowledge required to make what they do not yet have. Recognizing this shift has important implications for how development strategies are conceived, implemented, and ultimately judged.
References
Amsden, Alice Hoffenberg. 1989. Asia’s next giant: South Korea and late industrialization. Oxford University Press.
Bahar, Dany, and Miguel A Santos. 2018. “One more resource curse: Dutch disease and export concentration.” Journal of Development Economics , 132: 102–114.
Bahar, Dany, Samuel Rosenow, Ernesto Stein, and Rodrigo Wagner. 2019. “Export take-offs and acceleration: Unpacking cross-sector linkages in the evolution of comparative advantage.” World Development , 117: 48–60.
Balassa, Bela. 1965. “Trade liberalisation and “revealed” comparative advantage 1.” The manchester school , 33(2): 99–123.
Balassa, Bela. 1971. The Structure of Protection in Developing Countries. Johns Hopkins University Press.
Bhagwati, Jagdish N. 1978. Anatomy and Consequences of Exchange Control Regimes.
Ballinger.
Blonigen, Bruce A. 2016. “Industrial policy and downstream export performance.” The Economic Journal , 126(595): 1635–1659.
Bustos, Sebastian, and Muhammed A Yildirim. 2022. “Production ability and economic growth.” Research Policy , 51(8): 104153.
Cahyaningrum, Dian. 2023. “Indonesia’s ban on the export of raw mineral natural resources: Nickel and Bauxite.” Conte, Maddalena, Pierre Cotterlaz, Thierry Mayer, et al. 2022. “The CEPII gravity database.” Devlin, Julia, and Sheridan Titman. 2004. “Managing oil price risk in developing countries.” The World Bank Research Observer , 19(1): 119–139.
Diodato, Dario, Frank Neffke, and Neave O’Clery. 2018. “Why do industries coagglomerate? How Marshallian externalities differ by industry and have evolved over time.” Journal of Urban Economics , 106: 1–26.
Ellison, Glenn, Edward L Glaeser, and William R Kerr. 2010. “What causes industry agglomeration? Evidence from coagglomeration patterns.” American Economic Review , 100(3): 1195–1213.
Evans, Peter B. 1995. Embedded autonomy: States and industrial transformation. Princeton University Press.
Federal Republic of Nigeria. 2021. “National Development Plan 2021–2025, Volume I.” Federal Ministry of Finance, Budget and National Planning, Abuja.
Feinberg, Robert M, and Seth Kaplan. 1993. “Fishing downstream: The political economy of effective administered protection.” Canadian Journal of Economics , 150– 158.
Gobierno de Chile. 2023. “Estrategia Nacional del Litio: Por Chile y su Gente [National Lithium Strategy: For Chile and its People].” Government policy document.
Government of the Democratic Republic of the Congo. 2022. “National Development Plan 2022–2026.” Ministry of Planning, Kinshasa.
Government of the Republic of Indonesia. 2023. “Indonesia Vision 2045.” Ministry of National Development Planning, Jakarta.
Government of the United Republic of Tanzania. 2021. “The Third National Five- Year Development Plan (FYDP III) 2021/22–2025/26: Realising Competitiveness and Industrialisation for Human Development.” Ministry of Finance and Planning, Dodoma.
Hall, Bronwyn H, Adam B Jaffe, and Manuel Trajtenberg. 2001. “The NBER patent citation data file: Lessons, insights and methodological tools.” Hausmann, Ricardo, Bailey Klinger, and Robert Lawrence. 2008. “Examining beneficiation.” Hausmann, Ricardo, César A Hidalgo, Sebastián Bustos, Michele Coscia, and Alexander Simoes. 2014. The atlas of economic complexity: Mapping paths to prosperity. Mit Press.
Hausmann, Ricardo, Daniel P Stock, and Muhammed A Yıldırım. 2022. “Implied comparative advantage.” Research Policy , 51(8): 104143.
Hidalgo, César A, Bailey Klinger, A-L Barabási, and Ricardo Hausmann. 2007.
“The product space conditions the development of nations.” Science , 317(5837): 482–487.
Hirschman, Albert O. 1968. “The political economy of import-substituting industrialization in Latin America.” The Quarterly Journal of Economics , 82(1): 1–32.
Hirschman, Albert O. 1981. Essays in trespassing: Economics to politics and beyond.
Cambridge University Press.
Hoekman, Bernard M, and Michael P Leidy. 1992. “Cascading contingent protection.” European Economic Review , 36(4): 883–892.
Kohli, Atul. 2004. State-directed development: political power and industrialization in the global periphery. Cambridge university press.
Krueger, Anne O. 1978. Foreign Trade Regimes and Economic Development: Liberalization Attempts and Consequences. Ballinger for NBER.
Krupp, Corinne M, and Susan Skeath. 2002. “Evidence on the upstream and downstream impacts of antidumping cases.” The North American Journal of Economics and Finance , 13(2): 163–178.
Lall, Sanjaya. 2000. “The Technological structure and performance of developing country manufactured exports, 1985-98.” Oxford development studies , 28(3): 337–369.
Lane, Nathan. 2025. “Manufacturing revolutions: Industrial policy and industrialization in South Korea.” The Quarterly Journal of Economics , qjaf025.
Lashitew, Addisu A, Michael L Ross, and Eric Werker. 2021. “What drives successful economic diversification in resource-rich countries?” The World Bank Research Observer , 36(2): 164–196.
Leamer, Edward E. 1984. “Sources of international comparative advantage. Theory and evidence.” Liebman, Benjamin H, and Kasaundra M Tomlin. 2007. “Steel safeguards and the welfare of US steel firms and downstream consumers of steel: a shareholder wealth perspective.” Canadian Journal of Economics/Revue canadienne d’économique , 40(3): 812– 842.
Lin, Justin Yifu. 2012. New Structural Economics: A Framework for Rethinking Development and Policy. World Bank.
Little, I. M. D., Tibor Scitovsky, and Maurice Scott. 1970. Industry and Trade in Some Developing Countries. Oxford University Press.
Liu, Ernest. 2019. “Industrial policies in production networks.” The Quarterly Journal of Economics , 134(4): 1883–1948.
Ministry of Planning and National Development, Government of the Republic of Kenya. 2007. “Kenya Vision 2030: The Popular Version.” Government of the Republic of Kenya, Nairobi.
National Planning Commission of South Africa. 2012. “National Development Plan 2030: Our Future – Make It Work.” Government of the Republic of South Africa, Pretoria.
Nunn, Nathan. 2007. “Relationship-specificity, incomplete contracts, and the pattern of trade.” The quarterly journal of economics , 122(2): 569–600.
Ostensson, Olle. 2019. “Promoting downstream processing: resource nationalism or industrial policy?” Mineral Economics , 32(2): 205–212.
Planning and Development Commission (Ethiopia). 2021. “The Ten-Year Development Plan (2021-2030): A Pathway to Prosperity.” Government of Ethiopia, Addis Ababa.
Prebisch, Raul. 1950. “The economic development of Latin America and its principal problems.” Pritchett, Lant, Kunal Sen, and Eric Werker. 2018. Deals and development: The political dynamics of growth episodes. Oxford University Press.
Puga, Diego, and Anthony J Venables. 1999. “Agglomeration and economic development: Import substitution vs. trade liberalisation.” The Economic Journal , 109(455): 292–311.
Rachapalli, Swapnika. 2024. “Vertical Spillovers in Global Value Chains.” Vol. 114, 124– 129, American Economic Association 2014 Broadway, Suite 305, Nashville, TN 37203.
Romalis, John. 2004. “Factor proportions and the structure of commodity trade.” American Economic Review , 94(1): 67–97.
Ross, Michael L. 2017. “What Do We Know About Economic Diversification in Oil- Producing Countries?” Available at SSRN 3048585 .
Sachs, Jeffrey D, and Andrew Warner. 1995. “Natural resource abundance and economic growth.” Singer, HW. 1950. “The Distribution of Gains between Investing and Borrowing Countries.” The American Economic Review , 40(2): 473–485.
Sleuwaegen, Leo, René Belderbos, and Clive Jie-A-Joen. 1998. “Cascading contingent protection and vertical market structure.” International Journal of Industrial Organization , 16(6): 697–718.
SWAPO Party. 2024. “Unity in Diversity: Natural Resources Beneficiation and Youth Empowerment for Sustainable Development. SWAPO Party 2024 Elections Manifesto.” SWAPO Party, Solidarity Freedom House.
The People Daily. 2021. “Vision 2030 Economic Pillar: Moving the Economy up the Value Chain.” The People Daily News .
Van Der Ploeg, Frederick, and Steven Poelhekke. 2019. “The impact of natural resources: Survey of recent quantitative evidence.” In Why does development fail in resource rich economies . 31–42. Routledge.
Venables, Anthony J. 2016. “Using natural resources for development: why has it proven so difficult?” Journal of Economic Perspectives , 30(1): 161–184.
von Vacano, Diego. 2024. “Miracle or Mirage? Lithium Governance and Prospects in Bolivia.” Woodrow Wilson International Center for Scholars, Washington, DC.
Weidner, Martin, and Thomas Zylkin. 2021. “Bias and Consistency in Three-Way Gravity Models.” Journal of International Economics , 132: 103513.
Figure 1: Illustration of density
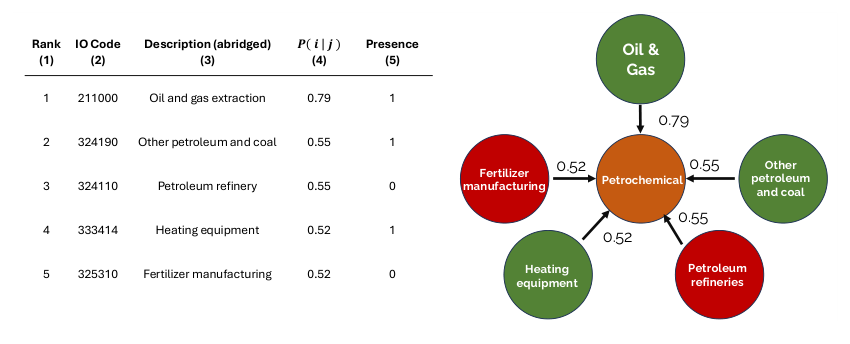
Table 2: Summary statistics – industry presence, entry and exit, and densities
Density – Proximity (co-location) 186 , 167 0 . 000 0 . 000 0 . 128 0 . 206 0 . 561 1 . 000 0 . 231 Density – share of inputs from upstream industries 186 , 167 0 . 000 0 . 000 0 . 051 0 . 196 0 . 640 1 . 000 0 . 274 Density – similarity in upstream inputs 186 , 167 0 . 000 0 . 000 0 . 122 0 . 203 0 . 544 1 . 000 0 . 235 Density – similarity in upstream / tradable inputs 186 , 167 0 . 000 0 . 000 0 . 124 0 . 203 0 . 542 1 . 000 0 . 233 Density – similarity in upstream / non-tradable inputs 186 , 167 0 . 000 0 . 000 0 . 121 0 . 199 0 . 531 1 . 000 0 . 229 Density – similarity in occupations 186 , 167 0 . 000 0 . 000 0 . 124 0 . 208 0 . 562 1 . 000 0 . 242 Density – similarity in occupations / high-skill 186 , 167 0 . 000 0 . 000 0 . 101 0 . 196 0 . 539 1 . 000 0 . 239 Density – similarity in occupations / low-skill 186 , 167 0 . 000 0 . 000 0 . 123 0 . 208 0 . 562 1 . 000 0 . 243 Density – similarity in patents 186 , 167 0 . 000 0 . 000 0 . 000 0 . 122 0 . 429 1 . 000 0 . 205 Density – Proximity (co-location) 90 , 486 0 . 000 0 . 000 0 . 045 0 . 109 0 . 318 1 . 000 0 . 158 Density – share of inputs from upstream industries 90 , 486 0 . 000 0 . 000 0 . 000 0 . 102 0 . 363 1 . 000 0 . 190 Density – similarity in upstream inputs 90 , 486 0 . 000 0 . 000 0 . 036 0 . 106 0 . 319 1 . 000 0 . 158 Density – similarity in upstream / tradable inputs 90 , 486 0 . 000 0 . 000 0 . 041 0 . 108 0 . 318 1 . 000 0 . 161 Density – similarity in upstream / non-tradable inputs 90 , 486 0 . 000 0 . 000 0 . 038 0 . 105 0 . 321 1 . 000 0 . 153 Density – similarity in occupations 90 , 486 0 . 000 0 . 000 0 . 034 0 . 106 0 . 310 1 . 000 0 . 160 Density – similarity in occupations / high-skill 90 , 486 0 . 000 0 . 000 0 . 022 0 . 098 0 . 297 1 . 000 0 . 160 Density – similarity in occupations / low-skill 90 , 486 0 . 000 0 . 000 0 . 035 0 . 106 0 . 317 1 . 000 0 . 161 Density – similarity in patents 90 , 486 0 . 000 0 . 000 0 . 000 0 . 071 0 . 238 1 . 000 0 . 145 Density – Proximity (co-location) 30 , 179 0 . 000 0 . 125 0 . 436 0 . 451 0 . 797 1 . 000 0 . 250 Density – share of inputs from upstream industries 30 , 179 0 . 000 0 . 000 0 . 354 0 . 398 0 . 919 1 . 000 0 . 332 Density – similarity in upstream inputs 30 , 179 0 . 000 0 . 042 0 . 396 0 . 413 0 . 782 1 . 000 0 . 266 Density – similarity in upstream / tradable inputs 30 , 179 0 . 000 0 . 051 0 . 386 0 . 406 0 . 773 1 . 000 0 . 261 Density – similarity in upstream / non-tradable inputs 30 , 179 0 . 000 0 . 000 0 . 372 0 . 397 0 . 754 1 . 000 0 . 267 Density – similarity in occupations 30 , 179 0 . 000 0 . 074 0 . 425 0 . 440 0 . 830 1 . 000 0 . 274 Density – similarity in occupations / high-skill 30 , 179 0 . 000 0 . 000 0 . 389 0 . 413 0 . 778 1 . 000 0 . 275 Density – similarity in occupations / low-skill 30 , 179 0 . 000 0 . 065 0 . 421 0 . 439 0 . 831 1 . 000 0 . 276 Density – similarity in patents 30 , 179 0 . 000 0 . 000 0 . 048 0 . 212 0 . 598 1 . 000 0 . 265 Notes: Panel A reports summary statistics for the full sample, Panel B for industries at entry, and Panel C for industries at exit. Percentiles are denoted p q .
Table 3: Determinants of co-presence probability
Table 4: Determinants of co-presence probability for NNRR industries
Table 5: Determinants of Exports Industry Entry and Exit
Table 6: PPML estimates of determinants of Export’s intensive margin
Export value in t + 5 Variables (1) (2) (3) (4)
Density – proximity (co-location) 0.134*** (0.022)
Density – share of inputs from upstream industries 0.035*** 0.014 0.015 (0.012) (0.011) (0.011) Density – similarity in upstream inputs 0.026* (0.016) Density – similarity in upstream / tradables 0.024* (0.014) Density – similarity in upstream / non-tradables -0.033* (0.020)
Density – similarity in occupations 0.107*** (0.033) Density – similarity in occupations / high-skill 0.026 (0.024) Density – similarity in occupations / low-skill 0.087*** (0.029)
Density – similarity in patent citations 0.024 0.026* (0.015) (0.015)
Market access, log 0.478*** 0.489*** 0.487*** 0.483*** (0.130) (0.135) (0.125) (0.125) RCA 0.107*** 0.113*** 0.108*** 0.109*** (0.016) (0.017) (0.016) (0.016)
Observations 153,841 153,841 153,841 153,841 Table shows PPML estimates controlling for country-year and industry-year fixed effects. Robust standard errors in parentheses, clustered two-way by countries and industries. ⇤⇤⇤ p < 0 . 01 , ⇤⇤ p < 0 . 05 , ⇤ p < 0 . 1 .
Table 7: Determinants of Exports Industry Entry and Exit Natural Resource Rich Coun- tries
Table 8: Industry Entry and Exit with Alternative K -Nearest-Neighbors
Density – share of inputs from upstream industries 0.050 0.063 0.064 0.068 0.078 0.089 0.098 0.097 0.100 0.092 (0.078) (0.077) (0.073) (0.073) (0.075) (0.076) (0.076) (0.076) (0.075) (0.073) Density – similarity in upstream inputs 0.132 0.108 0.172* 0.325*** 0.459*** 0.448*** 0.425*** 0.488*** 0.519*** 0.671*** (0.081) (0.096) (0.100) (0.111) (0.134) (0.149) (0.153) (0.171) (0.169) (0.185) Density – similarity in occupations 0.454*** 0.509*** 0.536*** 0.569*** 0.342*** 0.341*** 0.378*** 0.366*** 0.379*** 0.320** (0.099) (0.113) (0.119) (0.116) (0.109) (0.118) (0.125) (0.134) (0.136) (0.143) Density – similarity in patent citations 0.157** 0.172** 0.106 0.025 0.054 -0.007 0.011 0.009 -0.010 0.001 (0.069) (0.082) (0.095) (0.098) (0.105) (0.102) (0.107) (0.111) (0.109) (0.107) Market access, log 2.339*** 2.350*** 2.419*** 2.429*** 2.416*** 2.433*** 2.449*** 2.449*** 2.449*** 2.447*** (0.724) (0.726) (0.723) (0.721) (0.724) (0.724) (0.727) (0.729) (0.730) (0.730)
Density – share of inputs from upstream industries 0.146 0.188 0.182 0.240 0.214 0.205 0.192 0.179 0.172 0.160 (0.155) (0.168) (0.167) (0.170) (0.176) (0.180) (0.179) (0.178) (0.177) (0.178) Density – similarity in upstream inputs -0.434** -0.584*** -0.531*** -0.509** -0.423* -0.372 -0.328 -0.351 -0.381 -0.484 (0.171) (0.180) (0.178) (0.204) (0.228) (0.268) (0.271) (0.282) (0.287) (0.314) Density – similarity in occupations -0.217 -0.283 -0.375* -0.647*** -0.643*** -0.771*** -0.865*** -0.881*** -0.961*** -0.865*** (0.158) (0.191) (0.198) (0.218) (0.236) (0.266) (0.271) (0.258) (0.281) (0.310) Density – similarity in patent citations -0.554*** -0.707*** -0.772*** -0.838*** -0.998*** -0.984** -1.058*** -1.142*** -1.262*** -1.377*** (0.203) (0.251) (0.293) (0.313) (0.359) (0.383) (0.404) (0.428) (0.450) (0.474) Market access, log 0.994 1.037 1.048 1.043 0.992 0.989 0.947 0.855 0.839 0.827 (1.144) (1.144) (1.144) (1.145) (1.150) (1.153) (1.158) (1.156) (1.158) (1.157)
Table 9: Determinants of Industry Entry and Exit by Alternative Time Horizons