Abstract
Growth Diagnostics and Competitiveness Study of the Manufacturing Sector in Tanzania Bailey Klinger, Miguel Angel Santos, Camila Arroyo, and Ekaterina Vashkinskaya CID Research Fellow and Graduate Student Working Paper No. 152 June 2023 © Copyright 2023 Klinger, Bailey; Santos, Miguel; Arroyo, Camila; Vashkinskaya, Ekaterina; and the President and Fellows of Harvard College at Harvard University Center for International Development Working Papers…
© Copyright 2023 Klinger, Bailey; Santos, Miguel; Arroyo, Camila; Vashkinskaya, Ekaterina; and the President and Fellows of Harvard College


\ Bailey Klinger Miguel Angel Santos Camila Arroyo Ekaterina Vashkinskaya June 2023
This report has been prepared by the Growth Co-Lab team composed of Bailey Klinger (Research Partner Facilitator), Miguel Angel Santos (Director Growth Co-Lab), Camila Arroyo (Policy Officer), and Ekaterina Vashkinskaya (Policy Officer). We are thankful for the feedback provided by Ricardo Hausmann (Harvard University) and Douglas Barrios (Director, Policy Research Growth Lab), and research assistance from Ana Abad and Fernando Pino. The team benefited from the support of the Confederation of Tanzania Industries in conducting field research, including Leodegar Tenga, Anna Kimaro, and Isack Msungu. The team also received feedback and support from Janet Mortoo from the European Commission, the World Bank Tanzania Country Office team led by Rob Swinkels, and Frederic Bustelo from SNV. We are also thankful to various officials from the Ministry of Investment, Industry and Trade (MIIT) for their support in the coordination and facilitation of the study, Dr. Wilson Lugano, Eng. Caroline Lyimo, and Yusuf Mwiyuki. The team received databases from the National Bureau of Statistics and the Bank of Tanzania that were crucial for the analytical work. The report has benefited from useful discussions with Xinshen Diao, Mia Ellis, Margaret McMillan, and Dani Rodrik, who also provided the balanced panel of ASIP panel data which greatly facilitated the research work. The usual disclaimers apply.
Report Growth Diagnostics and Competitiveness Study of the Manufacturing Sector in Tanzania 4
3.1.1. CTI role 105
Appendix 2: Agenda trip to Tanzania 121
Report Growth Diagnostics and Competitiveness Study of the Manufacturing Sector in Tanzania 5
Overview
The Tanzanian economy experienced a significant acceleration over two decades, growing at a compounded annual growth rate of 6% between 1998 and 2018. Within the context of such a positive performance, it is noteworthy that the manufacturing sector did not increase its share of gross domestic product (GDP), which lingered below 10% throughout the same period. The formal manufacturing sector is capital-intensive and highly productive but stagnant, while employment in Tanzania remains concentrated in agriculture and – to a lesser degree – services. Despite having attractive nearby opportunities for diversification, manufacturing exports are unsophisticated and their contribution to the export basket remains small. This study deploys the Growth Diagnostic frame work within Tanzania’s manufacturing sector to promote a better understanding o f the reasons why the country has failed to achieve its industrialization goals.
Growth Diagnostics is a methodology initially proposed by Hausmann, Rodrik, and Velasco (2008) as a framework to prioritize reforms that address the most pressing constraints preventing growth. The authors proposed a simple framework where investment and economic growth are determined by the returns to factor accumulation, the appropriability of these returns and the costs of financing. In a world where production factors tend to be more complements than substitutes, the factor in the shortest relative supply – the most binding constraint – is the one with the highest estimated growth payoff and shall be prioritized within the allocation of policy attention and government resources. The framework has evolved into a set of data-driven tests examining all key production inputs, including finance, human capital, infrastructure, government failures at the macroeconomic and microeconomic level, as well as coordination and information failures.
Growth Diagnostics exercises are better conceived as iterative processes, fertile ground for active collaboration among domestic government, private stakeholders, and technical experts. Datadriven insights and findings derived from econometric analysis are successively discussed, until a common diagnosis and an internally consistent policy plan is reached. In this study, we have deployed the Growth Diagnostic framework to identify the most binding constraints within the manufacturing sector in Tanzania.
Growth diagnostic findings The most binding factor constraining returns to investment in manufacturing in Tanzania is the availability and quality of electricity supply . Electricity is the number one challenge faced by large firms, as electrical outages are frequent and expensive for the manufacturing sector. Firms plan their production schedules and decide on plant locations based on power reliability. Yet the country has specialized in manufacturing subsectors more intensive in the use of electricity because tax and trade policies have been used to partially offset the infrastructure challenges. Moreover, there is significant evidence suggesting that investments in electricity generation have somewhat reduced this constraint over time, and there is a pipeline of new generation projects that – if completed successfully – could further alleviate it. In terms of other infrastructure, Tanzania seems to have made significant strides in improving the quality of transportation and communications, and while there are some inefficiencies and room for improvement – especially related to air transportation – the country does not seem to be performing worse off than its peers.
Microeconomic failures such as access to land, labor regulations, and red tape seem particularly relevant for international investors and exporters. Despite its low level of income, formal wage levels in Tanzania are not a competitive advantage to attract international investment. The taxation system is stuck in an equilibrium with relatively higher tax rates, a plethora of exemptions, and low tax collections. Land acquisition is particularly complicated for foreign investors, as the current legislation does not allow direct ownership. Moreover, the implementation of Export Processing Zones (EPZ) and Special Economic Zones (SEZ) has failed to provide serviced land, and in practice have had little impacts, with many firms in these zones facing steeper regulatory burdens. As foreign investors and export manufacturers are crucial for manufacturing growth, these constraints to their returns are particularly relevant. Other microeconomic failures, such corruption and crime, macroeconomic failures such as inflation and exchange rate volatility, and market failures, are all discarded as potential constraints.
Report Growth Diagnostics and Competitiveness Study of the Manufacturing Sector in Tanzania 9
Our diagnostic tests indicate that access to finance is not the most binding constraint in Tanzania today. Sectors less intensive in the use of finance do not seem to be thriving, but rather the opposite. Tanzania is surprisingly capital-intensive for its level of income, and the segments of the broader economy and manufacturing sector that are more intensive in finance tend to be larger and grow relatively faster, incentivized by tax and trade policy. Most tellingly, changes in the cost and supply of finance through time are not associated to corresponding changes in investment or output, neither for the economy nor for the manufacturing sector.
This does not mean that all is well in the country’s financial system . Tanzania enjoys a high savings rate, but those savings do not make it into the financial system. Given that capital flight is neither significant nor persistent in Tanzania, that is likely a result driven by the large cash-based informal economy. That results in low levels of credit to the private sector despite a reasonably competitive banking system. Real interest rates are persistently high, and the limited supply of credit is a common complaint of firms in the country. This is particularly harmful to smaller firms who can’t finance internally through retained earnings or tap into foreign savings. Improvements to financial intermediation and access to international finance would address what may become a binding constraint in the future, when restrictions associated to electricity supply are released and demand for investment in manufacturing resumes.
While we have uncovered evidence suggesting that the manufacturing sector requires an increased supply of workers with vocational training and continued access to skilled foreign workers, human capital is not holding down returns to investment in manufacturing. Educational attainment is expanding but returns associated to schooling are shrinking and are particularly low in the manufacturing sector. The unemployment rate among those with secondary education is high, and for those with tertiary education is rising quickly in the face of increasing supply, indicating that lack of demand for skills might be more of a problem than insufficient supply. Moreover, the availability of skills is one of the least-mentioned constraints in Tanzanian business surveys. Fewer firms are offering their own training to compensate for insufficient public training, and there is no relationship between sector dynamics and educational attainment.
In terms of investors’ ability to appropriate the returns to their investment, the strongest evidence points to the role of trade policy in compensating firms for other constraints. Taxation is relatively higher on labor and lower on capital, skewing returns away from the country’s relative labor abundance and towards scarce capital. This is reinforced by trade policy which supports capital and electricity-intensive firms, which thrive in the protected domestic economy while remaining uncompetitive in international markets. Such a policy also increases operating costs for other local firm s who can’t import lower -cost inputs. These set of policies go a long way in explaining the puzzling features of Tanzania’s economy .
Tanzania’s Manufacturing Syndrome The structure of Tanzania’s manufacturing sector today has been shaped by decades of inward-oriented policies. We have uncovered significant evidence suggesting that import substitution (now referred to as “ localization ” ) continues to be at the core of Tanzania’s industrial policy and shapes the incentives for the manufacturing sector today. The subscription to international agreements and trade blocks coexists with an environment that imposes a high regulatory burden on trading industries and restricts trade by means of tariff and non-tariff barriers, achieved by filing numerous exceptions to those treaties to protect individual products and entire domestic industries.
Tanzania has managed to develop an inward-oriented manufacturing sector that has made a significant contribution to employment and value added, but remains uncompetitive from an export standpoint. Higher degrees of protection for sub-sectors within manufacturing are associated with higher contributions to value added but lower contributions to exports. The problem is not the efficiency of these policies to deliver growth in the past, but rather that a) the space for further manufacturing growth through import substitution industrialization (ISI) is small and insufficient to meet the stated goals in terms of structural transformation and share of manufacturing in GDP, and b) growth has been concentrated among a small number of highly productive capital-intensive firms that have added few new employment opportunities.
Report Growth Diagnostics and Competitiveness Study of the Manufacturing Sector in Tanzania 10
Protective policies are biased towards energy and capital-intensive sectors and display a clear anti-export bias. Sectors that enjoy higher levels of protection and represent large shares of value added tend to be more capital intensive and display a moderate-to-high intensity in the use of energy. That, in turn, helps to explain the findings of Diao et al. (2021), who documented that the most productive firms in Tanzania are capital-intensive but do not expand employment, whereas the least productive firms within manufacturing did manage to create employment but at low levels of wages. The energy and capitalintensive bias of Tanzania’s manufacturing is relevant because these are two areas that display significant symptoms of being binding constraints.
Aside from these areas, there are also challenges to appropriability of returns coming from government failures, particularly microeconomic risks from taxes, red tape, and land availability . The signals for these constraints are not as strong as for electricity, but they seem particularly binding for international investors and exporters and appear to further orient production towards inwardly focused sectors that are capitaland electricity-intensive – in a laborabundant country with expensive finance and electricity shortages.
Efforts to promote export competitiveness in the manufacturing sector by means of EPZs and SEZs have failed to address the underlying constraints and resulted in significant corporate and withholding tax holidays for protected firms. EPZs and SEZs were established with the goal of promoting investment and exports and offered various benefits that included 10- year corporate and withholding tax holiday, VAT exemptions on raw materials and utilities, on-site customs inspection, eased immigration processes for high-skill foreign workers, unconditional transferability of profits, and access to one-stop-service centers. The most important constraints firms were facing – access to reliable electricity, serviced land, and relief from excessive regulatory burdens – have not been addressed by these zones, and according to various sources, even deteriorated in the case of red tape. In time, many firms have filed and become SEZs as stand-alone units, allowing them to benefit from tax benefits without either contributing to promoting economies of agglomeration nor increasing exports.
Failure to address the most binding constraints has in turn created a rationale for upholding protection, which in turn reinforces the capital and energy-intensiveness bias of the manufacturing sector. While protective trade policies have enabled firms to thrive in the domestic market, the persistence of the constraints identified renders them less competitive in the international arena. That persistence requires continuous protection for these firms to survive in the face of otherwise cheaper imports, and for government to maintain current domestic value added and employment in manufacturing. As a result, Tanzanian manufacturing remains uncompetitive in global markets, unable to tap into international demand to further growth and to move away from current patterns of protection. These trends have led to a stable but inefficient equilibrium, where growth and productivity are highly constrained by the size of the domestic market but must be maintained because of the high potential social and economic costs of lifting trade protection.
General policy recommendations • Rethink the incentives provided to manufacturing firms and craft an internally consistent plan to articulate the various relevant policy elements. The strategy should consider the manufacturing sub-sectors in Tanzania with the highest export growth potential and the most binding constraints that are preventing investment in these sectors. There are examples of countries that have protected selected industries without creating an anti-export bias. Thus, the strategy might not necessarily imply the rapid removal of tariff and non-tariff barriers, but it does entail revising what sectors are protected and what are the set of underlying incentives that ar e consistent with Tanzania’s goals for industrialization and structural transformation.
• In revising the incentives framework, the government must strike the right equilibrium and make parallel progress along two distinct policy dimensions. On the one hand, it must remove or alleviate the electricity constraints that are endemic to all manufacturing sectors as well as other constraints that might be hindering productivity in specific sub- Report Growth Diagnostics and Competitiveness Study of the Manufacturing Sector in Tanzania 11
sectors, such as access to serviced land, finance, regulatory inefficiency, and red tape. On the other hand, it must consider gradually phasing out tax holidays and trade protections that were put in place to compensate domestic producers for those constraints as they are lifted. In the process, some additional incentives could be provided such as eliminating tariffs on intermediate inputs for exporting manufacturing firms.
• As these issues are hard to address at the country level, special economic zones have the potential to become complete solutions for export-oriented investments. Government efforts should be focused in implementing effective interventions to address the shortcomings identified in the 2019-2024 Strategic Plan for EPZA.
o Target high-export growth potential sectors: We provide an initial roadmap based on the Economic Complexity framework, prioritizing clusters on chemicals (including plastics in primary forms, lubricants, polyamides, hydraulic fluids, makeup preparations, dental hygiene products, and cleaning products, among others), machinery and equipment (manufacture of machinery for mining, quarrying and construction, pumps, bearing, gears, among other products), medical instruments, and textiles.
o More and better electricity: It is important to secure the provision reliable and competitive electricity supply that affects manufacturing more broadly, plus other factors of production that might be hindering the prospects of specific subsectors. The most successful examples of these type zones tend to incorporate private investors either as direct owners of the zones or by means of termconcessions, granted by open bids that uncover information and reduce the likelihood of mismatches between the allocation of zones and availability of specific inputs, such as labor (skilled or unskilled) and trade infrastructure.
o This initial roadmap must be validated with domestic stakeholders and can potentially be filtered by criteria that is relevant to the specific context of Tanzania . Two obvious candidates are: 1) Electricity intensity: While the country completes the investment and regulatory framework required to remove the electricity constraint, it is wise to prioritize manufacturing industries that are less intensive in the use of energy, and 2) Environmental equilibrium: To promote manufacturing industries that are consistent with environmental standards, the environmental metrics at the product level coming US Environmentally Extended Input-Output (USEEIO) matrix can be used.
Report Growth Diagnostics and Competitiveness Study of the Manufacturing Sector in Tanzania 12
1. Growth trajectory
Tanzania is a lower middle-income country in Eastern Africa that has achieved strong growth and macroeconomic performance over the past two decades. Tanzania’s recent economic growth success follows a lengthy period of transformation and an economic history characterized by three different periods. From independence in 1964 the country adopted a socialist model with heavy state intervention and ownership. In the 1970s and the beginning of the 1980s Tanzania experienced a period of economic decline owing to the fall in commodity prices, oil price shocks, and the war with Uganda (1979-1980). In 1986 the country initiated a series of economic reforms, including a reduction in state ownership and involvement and some limited market liberalization. In the 1990s Tanzania accelerated its path towards market-friendly reforms opening the economy to international trade, liberalizing the financial sector, and unifying the exchange rate (Nord et al., 2009). A significant growth acceleration ensued, starting in 1998 and averaging 6% in real terms for the following two decades (Figure 1). As it happened to other countries in the region, the favorable growth rates recorded in recent decades have been supported by favorable commodity prices, public investment in infrastructure, and the rise of the service sector (WTO, 2019). During this period, the country also achieved strong macroeconomic stability due to prudent macroeconomic reforms including control of inflation, fiscal consolidation, liberalization of the financial sector, the creation of a market-oriented regulatory framework, and public fiscal management, among others (Dinh et al., 2013).
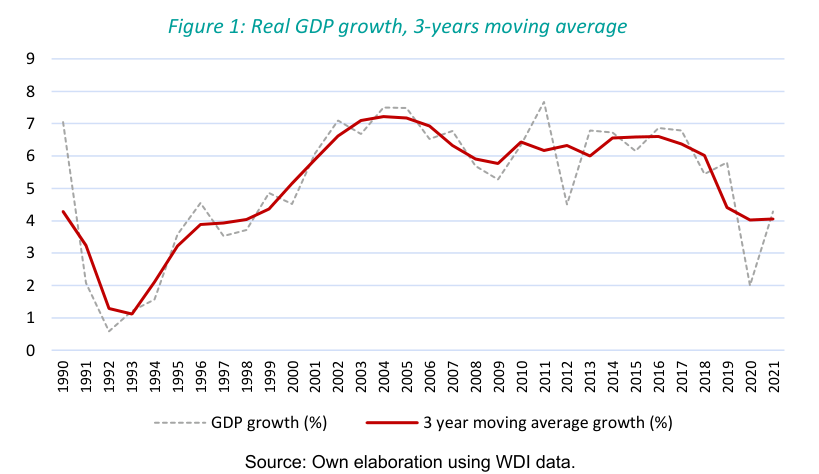
Source: Own elaboration using WDI data.
GDP per capita growth has decelerated, mostly driven by the increasing population. The population of Tanzania has also been growing rapidly over the past two decades. The growth rate went from 2% in 2000 to 3.5% in 2016. It declined to 3% in 2021 but remains higher than most of its peers 1 and the Sub-Saharan regional average of 2.6%. As a result, GDP per capita has grown at 3% over the past twenty years. Compared to peers, Tanzania’s performance is middling, with higher per capita growth than Uganda (2.6%), Kenya (1.6%), and South Africa (1%), but lower than regional peers Ethiopia (5.6%) and Ghana (3.3%), and lower than East Asian comparators Cambodia (5.3%) and Vietnam (5.2%) 2 . Projections by the World Bank indicated that if the country maintains both growth in GDP and population, by 2025 the GDP per capita would reach the current level for Ghana and Kenya, and well below the current levels of Indonesia, Thailand and South Africa (World Bank, 2017).
Report Growth Diagnostics and Competitiveness Study of the Manufacturing Sector in Tanzania 13
The economic reforms came associated with growth in both private and public investment. This was consistent with a period beginning in the middle of the 1990s marked by comprehensive reforms and the lifting of some constraints, particularly the deregulation of the banking sector, which increased the available capital for domestic private investment. Interestingly, even though private investment represents almost 60% of total investment, the boom over the most recent five years has been driven mostly by public investment. Public investment grew from 7% in 2015 to 18% in 2021, driven by investment in transport and energy infrastructure (World Bank, 2017). Meanwhile, private investment has remained constant (Figure 2).
Figure 2: Gross capital formation
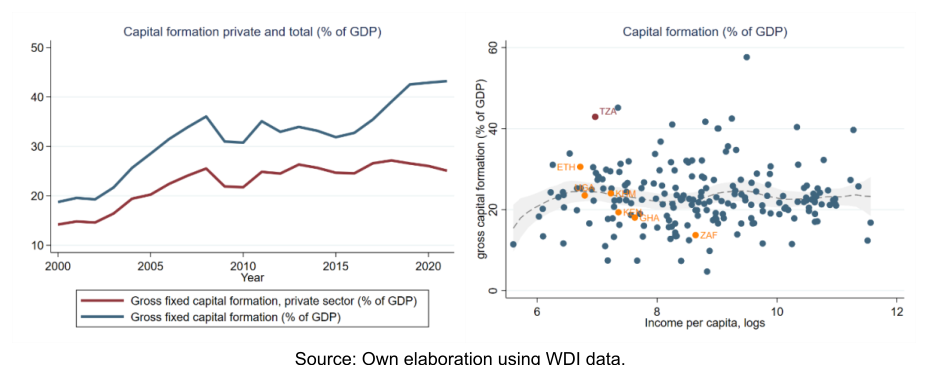
Source: Own elaboration using WDI data.
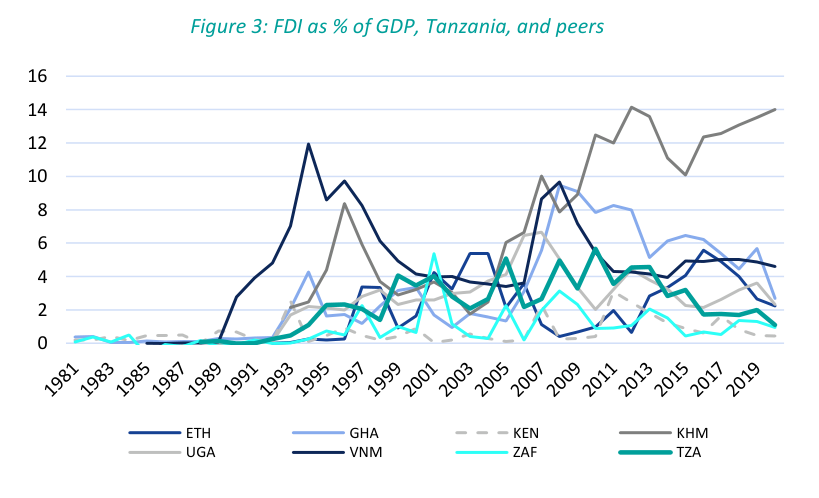
While the level of investment remains high, FDI has decreased in recent years and remains at levels lower than three decades ago. FDI also rose following the reform period from 1.4 to 6 percent of GDP between 1998 and 2010 but plummeted by 2020 to 1 percent of GDP. This is a more general phenomenon recorded in all commodity-concentrated exporters following the end of the commodity super-cycle. Tanzania is clearly in this group along with most regional peers, and has not become a destination for manufacturing-focused FDI which is more resilient to commodity price cycles, as can be seen in countries like Vietnam and Cambodia (Figure 3).
Source: Own elaboration using WDI data.
Report Growth Diagnostics and Competitiveness Study of the Manufacturing Sector in Tanzania 14
Tanzania’s growth acceleration was also fueled by the commodity super -cycle (2005-2014). Tanzania’s exports are dominated by primary commodities, while oil represents a relevant share of imports 3 . As in other countries in the region, the super-commodity cycle stimulated growth from the early 2000s to 2014. The price of gold increased steadily from 2004 to 2012, experiencing a steep decline of 30% in 2013 4 . The deterioration in the terms of trade in Tanzania experienced in 2012 is consistent with the decline in the GDP growth evidenced from 2013 onwards (Figure 4, Panel A, and Figure 1). Yet, the negative impact coming from the decline in commodity prices was lower in Tanzania than in other countries in the region. Tanzania’s moderate deterioration (less than 5%) in terms of trade is explained by the decrease in the price of gold, but as an oil-importing country, it was less affected than other oil-exporter countries in the region (World Bank, 2015). The end of the commodity super-cycle coincided with a reduction of the current account deficit, as lower oil prices affected imports more significantly than the decrease of gold prices affected exports, resulting in a recovery of Tanzania’s terms of trade (IMF, 2016).
Figure 4: Terms of trade
A. Net barter terms of trade – Tanzania B. Imports, and exports as % of GDP
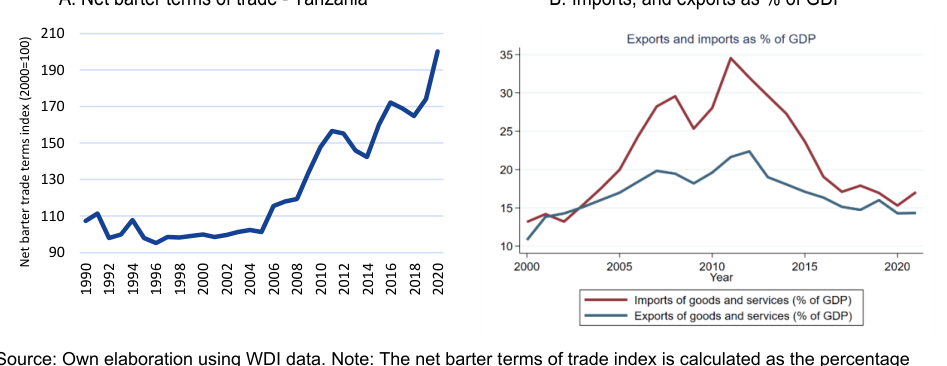
Source: Own elaboration using WDI data. Note: The net barter terms of trade index is calculated as the percentage ratio of the export unit value indexes to the import unit value indexes, measures relative to the base year 2000.
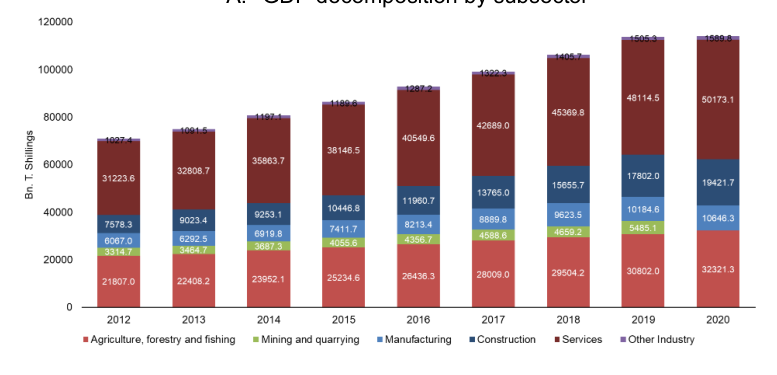
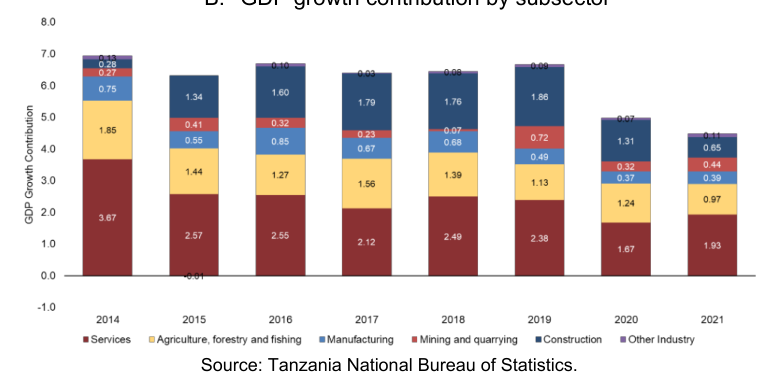
In the last decade, economic growth on the supply side has been primarily driven by an expansion of the services sector, followed by agriculture and construction. Figure 5 shows that services, agriculture, and construction account for the largest share of GDP (Panel A) and are the sectors that contributed most to GDP growth in the last decade (Panel B). While it is true that the manufacturing sector has almost doubled in absolute size in the last eight years (Panel A), it is among the sectors that contributed least to the GDP growth, accounting for less than 1% of GDP growth in the last decade (Panel B).
Tanzania’s export basket has diversified, but is still highly dependent on services, minerals, and agricultural products. While the expansion of services exports (transport and tourism) has been sustained since early 2000s, gold exports grew sharply starting in 2012 driven by high prices but fell afterwards along with commodity prices worldwide. Currently, both minerals and services represent almost two thirds of the export basket, and agriculture products accounts for approximately 20% of the basket. Manufacturing products (excluding basic metals as gold and unrefined cupper) represent a small proportion of the exports, though its development has helped the country to accommodate negative shocks on commodity exports (World Bank, 2017).
3 See country profile in the Atlas complexity webpage . 4 See gold historical gold prices in the following link .
Report Growth Diagnostics and Competitiveness Study of the Manufacturing Sector in Tanzania 15
Figure 5: GDP by subsector, constant 2015 prices
A. GDP decomposition by subsector
B. GDP growth contribution by subsector
Source: Tanzania National Bureau of Statistics.
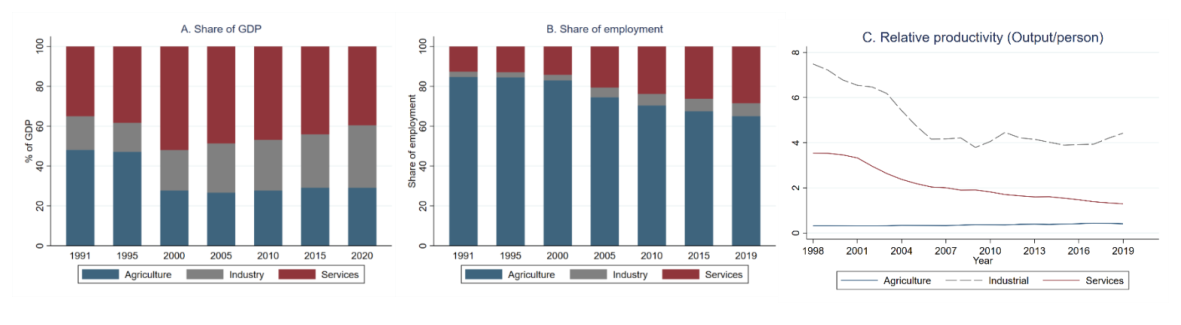
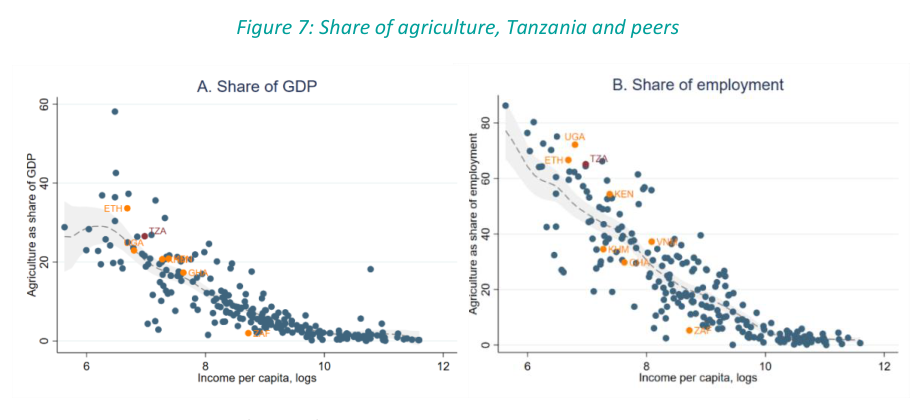
5 See Appendix 6: Fertility rates and income level, 2021. 6 The data used for this estimation is WDI, which defines agriculture employment using ILO standards. According to this definition, the agriculture sector consists of activities in agriculture, hunting, forestry, and fishing, in accordance with division 1 (ISIC 2) or categories A-B (ISIC 3) or category A (ISIC 4). This dataset contains information until 2019, and the proportion of agriculture employment was 65% in 2019. The Integrated Labor Force Survey (2021) indicates an updated number for 2021, indicating that 61.1% of the workers are involved in the agriculture sector (agriculture was defined by the employee’s industry , using ISIC rev 4 classifications).
Report Growth Diagnostics and Competitiveness Study of the Manufacturing Sector in Tanzania 16
Figure 6: Share of employment and GDP by sectors
Source: Own elaboration using WDI data.
Source: Own elaboration using WDI data.
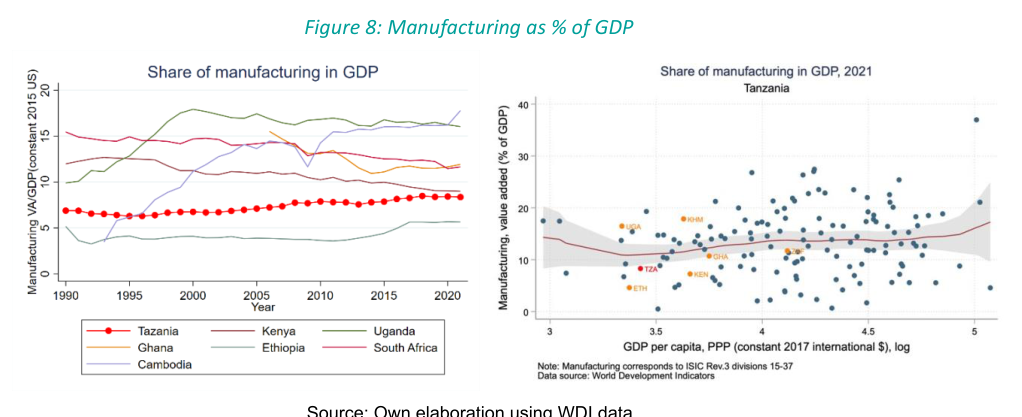
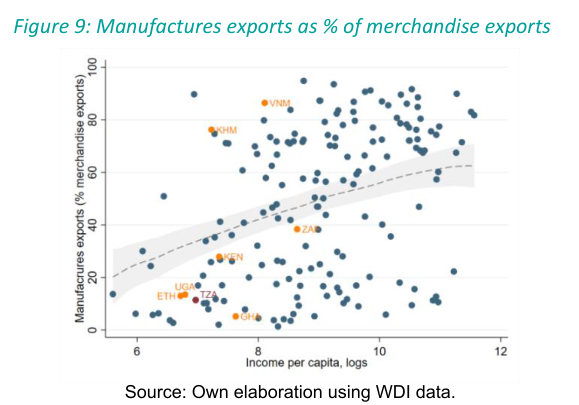
Growth in the manufacturing sector of Tanzania has not registered any significant take-off and its share of GDP is now shrinking. Manufacturing value added as a percent of GDP has remained relatively constant over the past three decades, increasing from 7% in 1990 to 8.4% in 2021 (Figure 8 ). In 2021, manufacturing’s share of GDP was well below the expected value given the country’s income, making Tanzania one of the least industrialized countries in the peer group (Figure 8). In 2020 the sector employed approximately 150 thousand workers in firms with more than 10 people, representing about 0.6% of total employment in the country 7 . The Census of Industrial Production conducted in 2013 considered firms with less than 10 employees and revealed approximately 260 thousand workers engaged in the manufacturing sector, representing 1% of the total employment in that year. Moreover, the share of manufacturing in total exports has remained below 25% from 1995 to 2020, making Tanzania one of the countries with the lowest manufacturing export shares in the peer group, well below the expected value given its income (Figure 9).
7 The total manufacturing sector employment was obtained from UNIDO’S estimations ( link ).
Report Growth Diagnostics and Competitiveness Study of the Manufacturing Sector in Tanzania 17
Source: Own elaboration using WDI data.
Source: Own elaboration using WDI data.
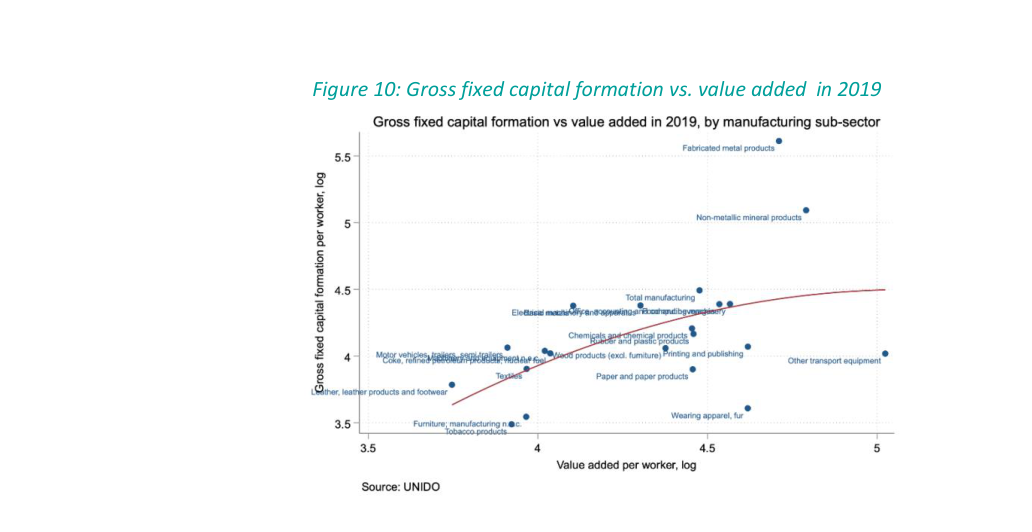
Though new jobs have been generated by the manufacturing sector in recent years, they have been mostly recorded by unproductive firms in the informal sector. According to Diao et al. (2021), while in some Asian countries (Taiwan and Vietnam) the share of formal sector manufacturing employment took off during their growth accelerations, in Tanzania the employment expansion was recorded in small and informal firms from 1998 onwards (the period in which the economy began to accelerate). As a result, there is a dichotomy in the current composition of the manufacturing sector in Tanzania. On the one hand, large formal firms are productive yet capital-intensive and do not create much employment. Meanwhile, employment growth in manufacturing has been limited to small and informal firms that create jobs but are not increasing productivity (and therefore wages). Consistent with Diao et al. (2021), we observe a positive relationship between value added and gross capital formation per worker (Figure 10).
Report Growth Diagnostics and Competitiveness Study of the Manufacturing Sector in Tanzania 18
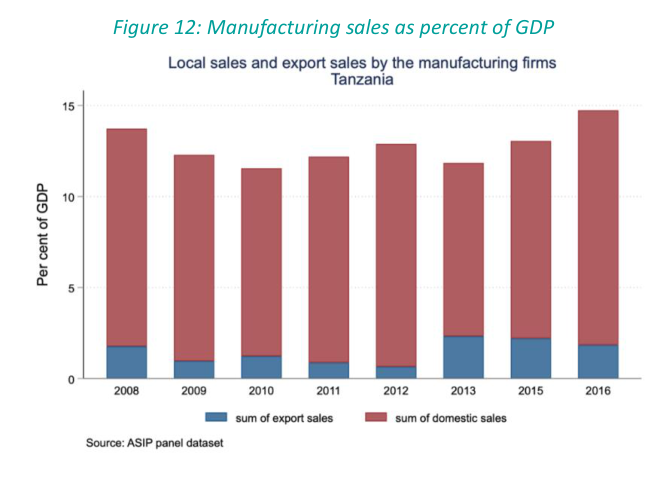
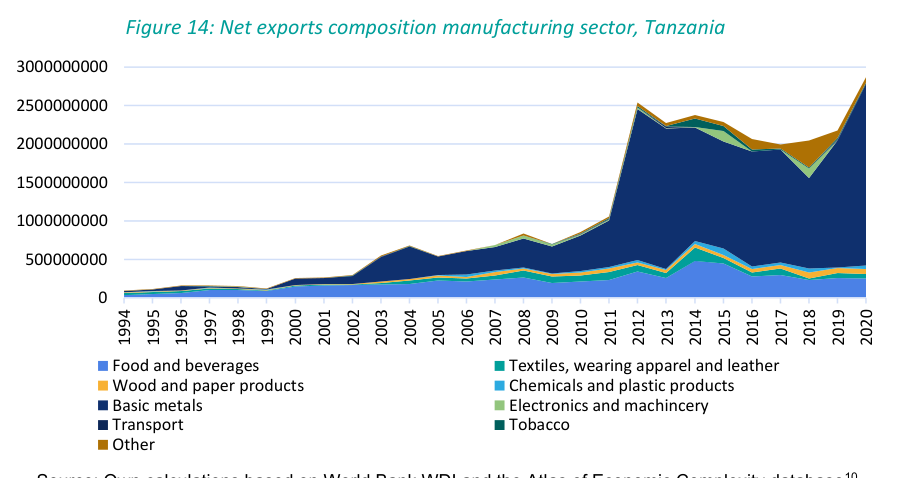
Manufacturing exports have increased over the last decade, particularly to Sub-Saharan Africa, yet most of the manufacturing output is sold in the domestic market. Net manufacturing exports rose significantly in 2011, mainly due to the growth of basic metals (gold and unrefined copper) and have remained relatively stable since 8 . The share of manufacturing exports directed to the Sub-Saharan region has increased from 18% in 2000 to 34% in 2020 (Figure 11, Panel A). When excluding basic metals, we can observe more clearly that Sub- Saharan Africa has increased its importance for Tanzania as an export destination, both in relative and absolute terms (Figure 11, Panel B). D espite this increase in exports, the country’s manufacturing sector remains highly focused on the domestic market, with sales to domestic customers representing about 13% of GDP versus 2% for export ( Figure 12 ), according to the annual survey of industrial production (ASIP).
Figure 11: Manufacturing exports, by destination
A. All manufacturing exports B. Manufacturing exports without basic metals
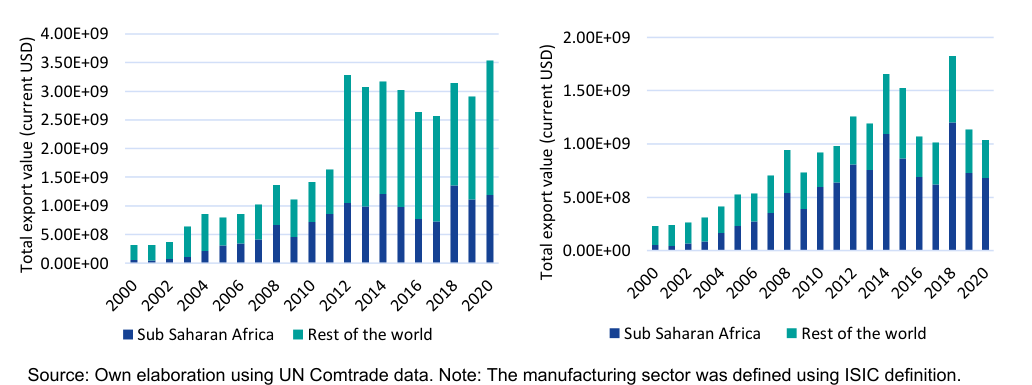
Source: Own elaboration using UN Comtrade data. Note: The manufacturing sector was defined using ISIC definition.
8 The database used for export composition is UN Comtrade data, which uses HS 92 for product classification. We homologated the HS92 classification with ISIC rev 3 in order to classify products in the UN Comtrade data, and mineral products (such as gold, and unrefined copper, among others) appear as part of the manufacturing sector. ASIP and UNIDO do not consider those products part of the manufacturing sector.
Report Growth Diagnostics and Competitiveness Study of the Manufacturing Sector in Tanzania 19
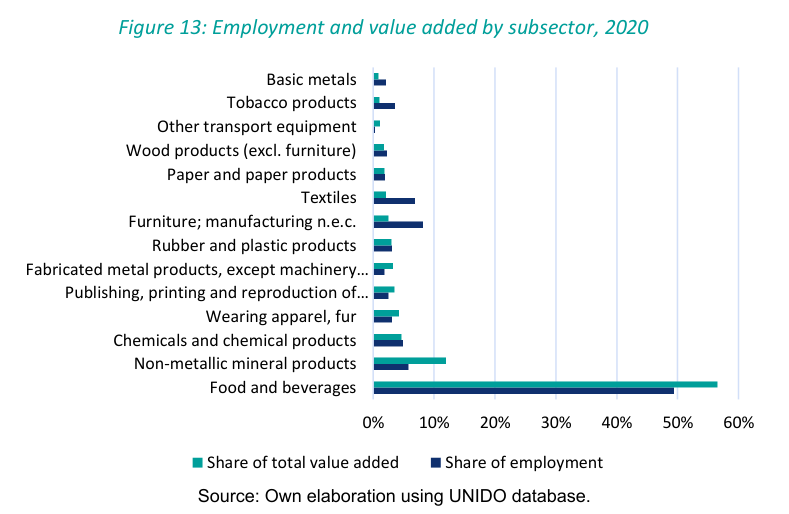
Within the manufacturing sector, Food and Beverages make up the largest share of manufacturing in Tanzania as measured by employment, value-added, and contribution to growth. Yet, when analyzing the manufacturing export basket, basic metals predominate, accounting for more than 80% of total exports in 2020 . Food and beverages represent almost 50% of manufacturing employment, followed by furniture, textiles, and non-metallic products (Figure 13). Food and Beverages also represent about 60% of the total value added in the manufacturing sector in 2019 and is the subsector that contributed most to the value-added manufacturing growth in the past decade 9 . Yet exports are dominated by basic metals, which accounted for more than 80% of the total exports in 2020 (Figure 14). The high proportion of basic metals in the export basket renders Tanzania vulnerable to external shocks, especially to swings in the price of gold in international markets. Furthermore, because of the large increase in the share of gold and copper in exports, food and beverages in exports shrank from 57% of total exports to less than 10% in the same period.
Report Growth Diagnostics and Competitiveness Study of the Manufacturing Sector in Tanzania 20
As the manufacturing export basket concentrates in basic mining and agricultural products, the complexity of the export basket remains low. We use the Product Complexity Index (PCI) to capture the sophistication of knowhow required to produce exported goods. By 2020 Tanzania ’s export basket had a relat ive complexity that was lower than average (below 0) 11 . While there are some chemical and textile products of higher relative complexity, they represent a very low proportion of the net exports (0.5%), placing Tanzania well below its peers. On average, 45% of total net exports in the peer group have a PCI above 0. Moreover, no subsector in the Tanzanian manufacturing export basket has an average PCI above 0, and the least sophisticated subsectors (basic metals and food and beverages) happen to be the largest (Figure 15).
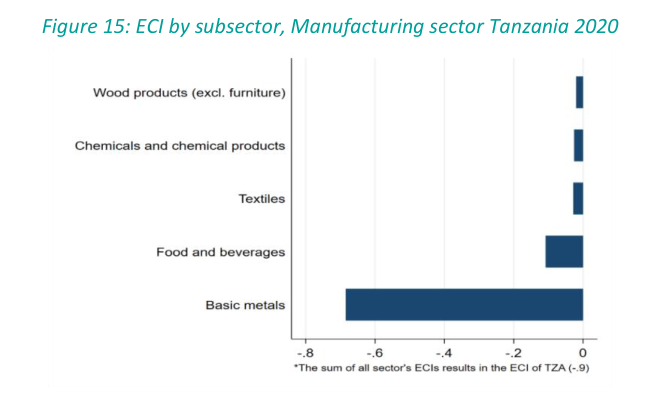
Source: Atlas of Economic Complexity, 2022. Note: The bar in the graph indicates the weighted ECI by subsector, i.e., ECI of the subsector multiplied by the share of exports of each category.
10 The database used for export composition is the Atlas Complexity data, which uses HS92 for product classification. We homologated the HS92 classification with ISIC REV 3 to classify products in the Atlas of Economic Complexity data, and mineral products (such as gold, and unrefined copper, among others) appear as part of the manufacturing sector. ASIP and UNIDO do not consider those products part of the manufacturing sector. 11 We considered products in which the country has a relative comparative advantage (RCA>1).
Report Growth Diagnostics and Competitiveness Study of the Manufacturing Sector in Tanzania 21
Since Tanzania’s manufactures are relatively unsophisticated – with little transformation over the past decade – the country ’s complexity has been declining relative to peers. The Economic Complexity Index (ECI) combines the PCIs of each export to generate a weighted average sophistication of know-how embedded in the export basket as a whole 12 . The ECI of Tanzania is the lowest amongst regional and international peers. In the last 20 years there has been an improvement in sophistication, but over the last decade the manufacturing sector has lagged in terms of complexity, going from the fourth highest to the second lowest in the group as of 2020 (Figure 17). Figure 16 shows that Tanzania’s manufacturing export basket is slightly less complex than expected for its level of income. Tanzania underperforms in export sophistication not only compared to wealthier countries like South Africa and Kenya, but also vis-a-vis other lowincome countries like Uganda.
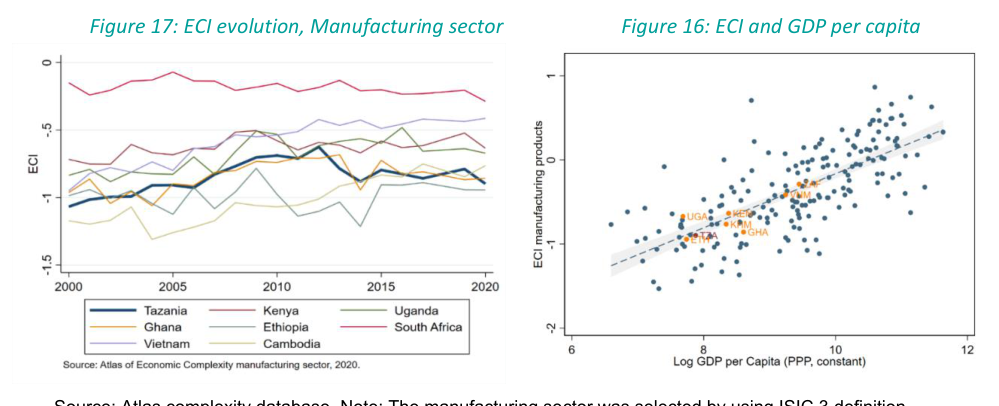
Source: Atlas complexity database. Note: The manufacturing sector was selected by using ISIC 3 definition.
Tanzania’s manufacturing exports are relatively unsophisticated, but its existing knowhow could be redeployed to conquer a moderately attractive set of opportunities for export diversification. In addition to the sophistication of what is currently exported, we can also measure how many sophisticated new sectors are ‘nearby’ in the product space. This Complexity Outlook Index (COI) signals the number of complex products that are near the country’s existing set of productive capabilities. Low COI indicates it will be more challenging to acquire new capabilities to increase overall ECI. Combining ECI and COI 13 into a strategy matrix 14 , we can distinguish what kind of industrial policies are called for by a country’s current set of know -how and nearby opportunities that entails. In the lower-left quadrant – low complexity and few nearby opportunities – are countries facing a steeper slope in promoting knowhow agglomeration and shall prioritize strategic bets that increase their connectivity and complexity. In the upper-left quadrant are countries that are not very complex but have relatively good connectivity – there are nearby products that might enhance their complexity. Restricting the analysis to the manufacturing sector as represented by exports, Tanzania is in the border between those two quadrants (Figure 18 ). The country’s economic complexity is low relative to its income and has been lagging but has some nearby opportunities that could be pursued by redeploying the existing set of productive capabilities and skills.
Report Growth Diagnostics and Competitiveness Study of the Manufacturing Sector in Tanzania 22
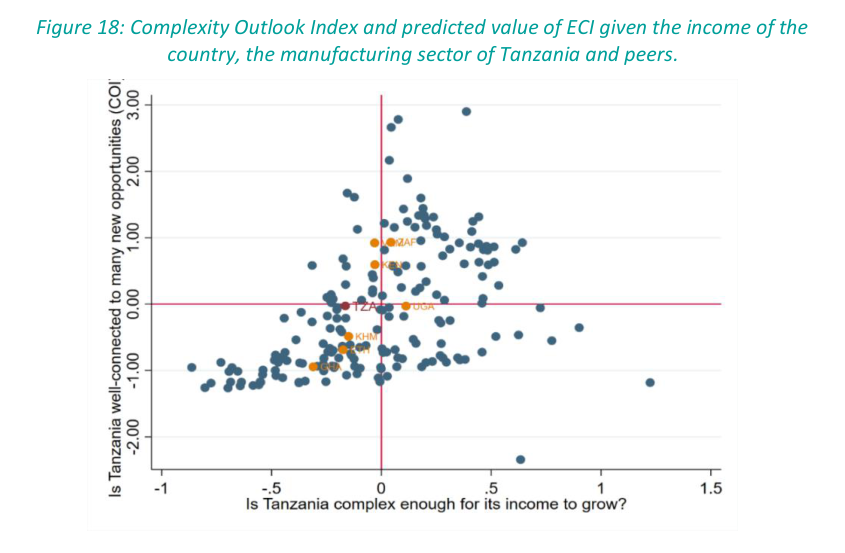
Source: Atlas of Economic Complexity, 2022. In summary, despite generally positive economic performance over recent decades, Tanzania is not achieving its ambitions of becoming an industrialized country, and its manufacturing sector has been lagging in terms of sophistication and exports. The country recorded a growth acceleration from 1998 onwards, and several efforts and strategies were adopted to promote industrial development 15 . At present, the development agenda emphasizes the importance of the industrial development to achieve broader economic goals (Wangawe et al., 2014). However, structural transformation has been lagging, as highlighted by the high share of agricultural employment and dichotomy in the manufacturing sector. Large and formal firms are productive yet capital-intensive and not noticeably expanding, while informal small firms are absorbing the largest share of employment in the sector and lag in productivity. Manufacturing is not a significant contributor to exports and – despite the presence of nearby opportunities for export diversification – there has been a generalized relative decline in the complexity and growth potential of the export basket. There must be significant binding constraints preventing investment, structural transformation, and employment creation in the manufacturing sector, and policies thus far have proven insufficient or inadequate to match the country’s goals. A Growth Diagnostic for the manufacturing sector is therefore a timely exercise, to help target future policies and government resources to issues with the largest impacts.
15 In 1996 Tanzania launched the Industrial Development Policy (SIDP 2020) plan, with the aim of enhancing sustainable development for the industrial sector. In 1999, the Development Vision was launched recognizing the importance of infrastructure development and technological transfer to carry out export-led industrialization. In 2010, the Integrated Industrial Development Strategy (IIDS 2025) was adopted narrowing down the targeted sector to six priorities industries: agro processing, textiles, leather, fertilizer and chemicals, light machinery, and iron and steel. The last version of the last version of National Five-Year Development Plan (FYDP 2021/22-2025/26) portray the central role of the industrial sector in driving growth and transformation.
Report Growth Diagnostics and Competitiveness Study of the Manufacturing Sector in Tanzania 23
2. Growth Diagnostics analysis
The Growth Diagnostic methodology hinges on several diagnostic tests applied from top to bottom on all production inputs organized along the Growth Diagnostic Tree (Figure 19). The tree is meant to be instructive, helping to organize the issues potentially constraining private investment, competitiveness, and overall growth in a certain place. It shall not be considered exhaustive or complete, as each context might have its own sets of issues that would need to be considered and properly tested. Moreover, some changes in the structure and branches might arise as a natural consequence of the process of deploying and adapting the Growth Diagnostic tree to the specifics of the manufacturing sector in Tanzania.
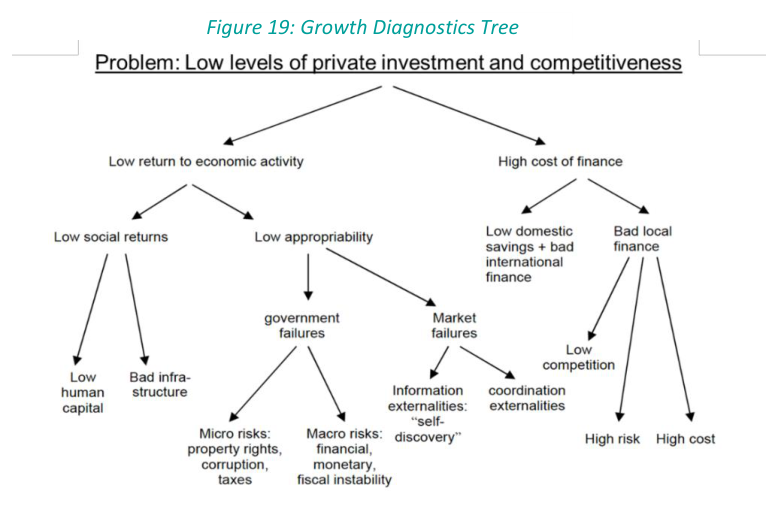
Source: Hausmann, Klinger and Wagner (2008).
The Growth Diagnostics methodology is a framework to organize an inquiry into the factors that are holding back economic performance in a certain a location, or a specific sector within a location. It allows for the use of many economic disciplines and tools in a practical and placefocused way. In some places it is useful to work explicitly through the entire diagnosis tree to test competing theories for what is holding its economic potential. The process allows for a focus on evidence rather than instincts and can help policymakers to focus scarce resources on problems most critical to growth that may have been poorly understood prior to the exercise. It is sometimes the case that multiple, related constraints are critical and underlying forces have allowed them to fester while reinforcing each other, but rarely all factors are binding at the same level. Once the most binding constraints have been identified, the Growth Diagnostic exercise should focus on explaining why these issues have persisted and become an inefficient equilibrium. Reaching this level of understanding entails elaborating further hypotheses and testing their implications. That is fertile ground for active collaboration with domestic stakeholders and technical subject matter experts on the ground. The result should be a process of collective thinking that is both dynamic and iterative, strengthens the robustness of the analyses, and gradually narrows the set of relevant hypotheses. That process may require multiple iterations until an acceptable level of convergence towards a consistent hypothesis is reached.
Report Growth Diagnostics and Competitiveness Study of the Manufacturing Sector in Tanzania 24
2.1. Access to finance
Access to finance is a binding constraint when projects with high risk-adjusted returns are not undertaken due to an inability to raise funds at competitive rates. The challenge lies in disentangling whether the observed outcome of low private investment is driven by a situation where numerous profitable projects can’t be financed (low supply of funds), or rather by one where there is finance available but not enough profitable projects (low demand for funds).
Three different causes can lead to a low supply of funds to undertake investment projects. The first reason may be low levels of domestic savings relative to the demand for investment credit, coped with lack of access to international markets. Even if domestic savings are low, profitable projects could tap into foreign savings through foreign direct investment (FDI) or via international financial markets, at least by large conglomerates or foreign firms. The second reason may be that those high savings are not available in the financial system, for example because of high cash-to-deposits in the economy or capital flight. The last reason might be poor financial intermediation: even if domestic savings are high and available in the financial system, funding to investors might be restricted by inefficiencies in financial intermediation.
We will first evaluate the symptoms of finance potentially being a binding constraint, and then test potential root causes underlying these symptoms. Even if the signals of differential diagnosis do not suggest that access to finance is the binding constraint, it is valuable to explore the potential drivers of the cost of finance: low domestic savings, lack of access to international funding, domestic savings not finding their way into the financial system, or inefficient financial intermediation.
2.1.1. Differential Diagnosis
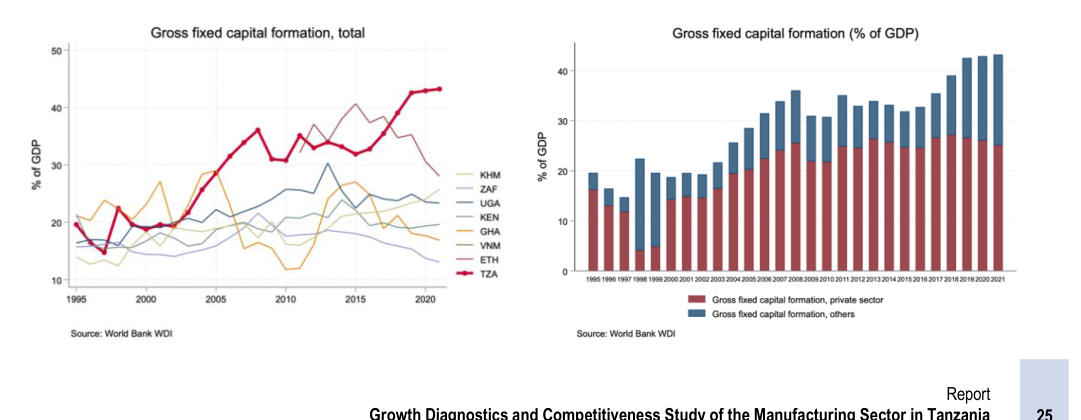
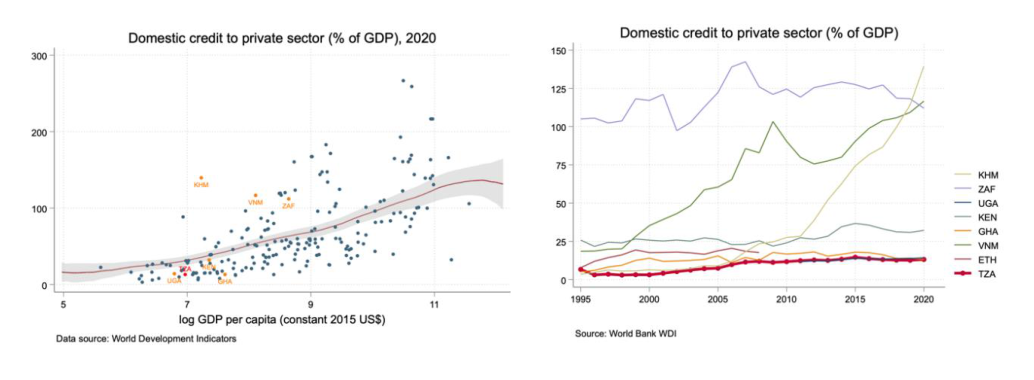
Tanzania displays both a high relative level of investment and a relatively low level of domestic credit to the private sector. This is an unusual combination, as investment would often be funded by the domestic financial system. Gross capital formation stood at around 43% of GDP in 2020-2021, which ranks Tanzania the highest among its peers. These levels of investment were driven by the private sector up until 2017. In recent years the trend has reversed, with public sector investments serving as the main driver of gross capital formation growth (Figure 20). Conversely, domestic credit to the private sector is low, standing at 13.1% of GDP in 2020, the last year with comparative data available (Figure 21). Even though there are discrepancies between the World Bank and the Bank of Tanzania data on the domestic lending to the private sector, those differences are not more than 3% of GDP and both sources indicate that credit to the private sector in 2020 is almost at the same levels as it was in 2010 after reaching historical highs around 2015- 2016. Tanzania’s surprisingly high levels of capital formation and capital intensity are also found in the manufacturing sector, as noted in detail in “Africa’s Manufacturing Puzzle: Evidence from Tanzanian and Ethiopian Firms” by Diao et al (2021).
Figure 20: Gross fixed capital formation
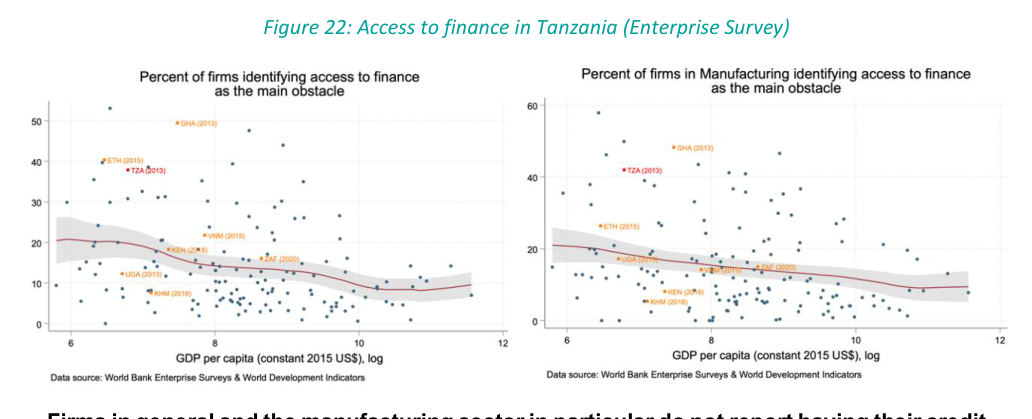
Firms do report that accessing external finance is a major problem in Tanzania, and manufacturing is not an exception. Almost 40% of Tanzania businesses identified access to finance as their biggest obstacle in the 2013 Enterprise Survey, up from 10% in 2006. That perception seems to be driven by small and medium-sized firms (SMEs), as 42% of small firms and 25% of medium firms considered access to finance (or the lack thereof) as their biggest obstacle in doing business in Tanzania. In contrast, only 9.8% of large firms (100+ employees) mentioned access to finance as their major concern. At the same time, Manufacturing firms are similar in terms of reporting constraints to the rest of the economy, however, the obstacles seem more pronounced. 42% and 65% of the firms in Manufacturing reported access to finance as a main or major obstacle to doing business respectively, one of the highest rates among peers and internationally (Figure 22).
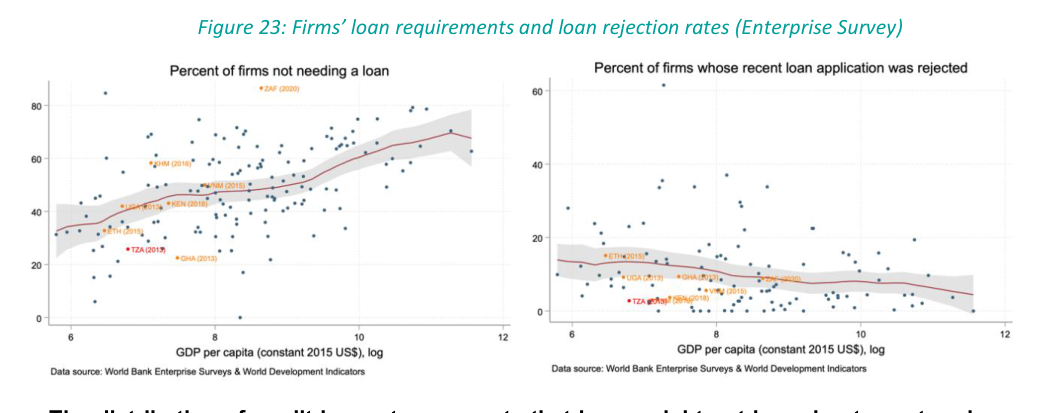
Firms in general and the manufacturing sector in particular do not report having their credit requests rejected, even though only around 20% of firms report not needing a loan. According to the Enterprise Survey Data, Tanzania has one of the lowest rates of loan rejection for its income level and the lowest in its peer group (Figure 23). Firms that are not able to finance their projects through retained earnings are also reluctant to apply for loans – an outcome possibly driven by low bankarization and high collateralization – and therefore record low levels of loan applications with high rates of approval. This situation might create a selection bias where only firms with enough capital to fund their operations internally stay afloat. Indeed, anecdotal evidence from our interviews with representatives from the manufacturing sector suggests that firms that tend to succeed either have a parental company abroad (that provides cheap credit or a financing line) or are part of a larger domestic business group that is big enough to pull money from operating profits. This excludes self-starters or small companies that require external financing.
Report Growth Diagnostics and Competitiveness Study of the Manufacturing Sector in Tanzania 26
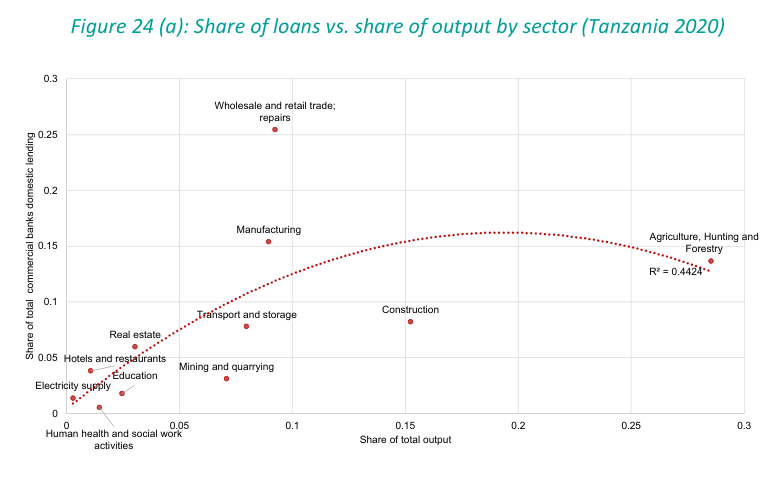
The distribution of credit by sector suggests that loans might not be going to sectors in line with their contribution to total output level and growth. Approximately a quarter of all commercial banks’ domestic loans reported by the Bank of Tanzania in 2020 go to retail16. Loans to retail appear overrepresented relative to the sector’s contribution to GDP ( Figure 24 panel a). Manufacturing, while bringing a comparable share of GDP, has as low as half of the domestic lending of the Retail sector. Mining and Real Estate also appear slightly underrepresented, which may be signaling international financing for those sectors. In terms of credit and output growth, one would normally expect to see an upward-sloping line, indicating that sectors experiencing larger growth receive more credit. Contrary to that, one observes significant contrasts between the shares of output and that of credit (Figure 24 panel b). Manufacturing, for example, grew by 5% growth 2018-2019 but its share of credit decreased by 0.8%. In Mining, on the other hand, growth by 2% was accompanied by a 13% credit expansion.
Report Growth Diagnostics and Competitiveness Study of the Manufacturing Sector in Tanzania 27
Figure 24 (b): Loans and output growth (Tanzania 2019)
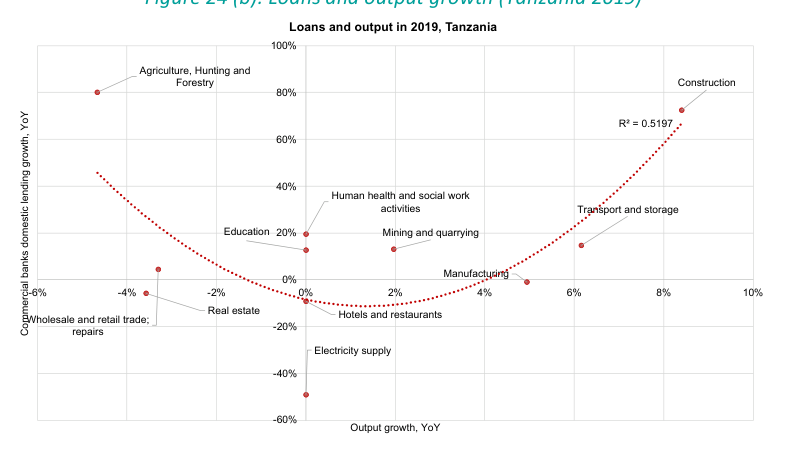
Source: Own elaborations based on Bank of Tanzania, National Bureau of Statistics. Note: the fitted lines on the graphs are second-order polynomial trendlines for each set of observations, with R-sq statistics presented alongside the trendlines.
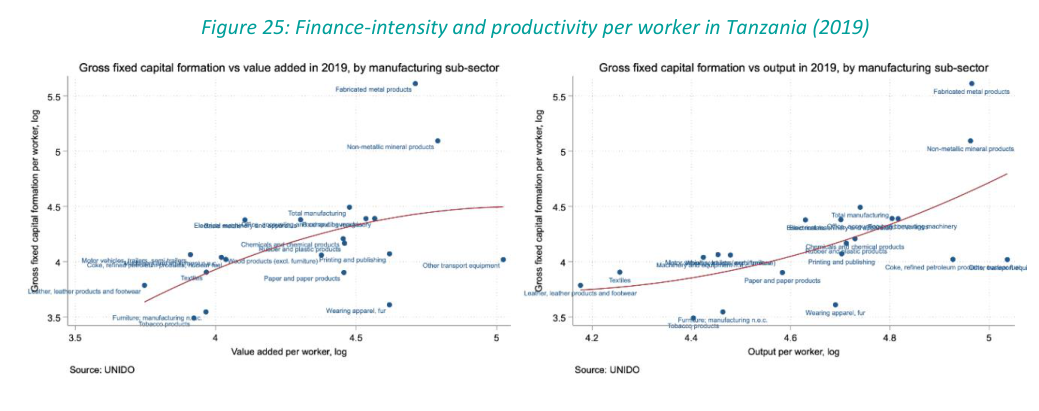
Within the manufacturing sector, there is a similar disconnect between the need for financing and productivity at the sub-sector level . If the gross capital formation variable is taken as a proxy for the sector’s intensity in the use of finance 17, we do not observe that those sectors that are more finance-intensive grow less in relative terms. Figure 25 Error! Reference source not found. shows that there is a positive relationship between the value added (or output) per worker and the capital per worker in 2019, thus growth is hardly restricted by the need to acquire capital and attract funds.
High real lending rates are persistent in Tanzania and are high among peers, limiting local firms’ access to credit ( Figure 26 ). The price of finance – the real interest rates – and its dynamics is the most important diagnostic signal in non-regulated financial markets. Indeed, twodigit real interest rates in Tanzania in 2019 are high from the international perspective and compared to peers. Tanzania fell further behind after 2016, following the exchange rate depreciation. From 2000 to 2016, the real annual rates averaged 7%, while the 2017-2020 period 17 This is a common metric for approximating the use of finance by an industry. See, for example, Rajan, and Zingales (1998) with the measure of industry’s intensiveness in finance associated to its capital -intensity.
Report Growth Diagnostics and Competitiveness Study of the Manufacturing Sector in Tanzania 28
saw an average rate of 14.8% (Figure 27).
Figure 26: Lending rates and access to credit in Tanzania
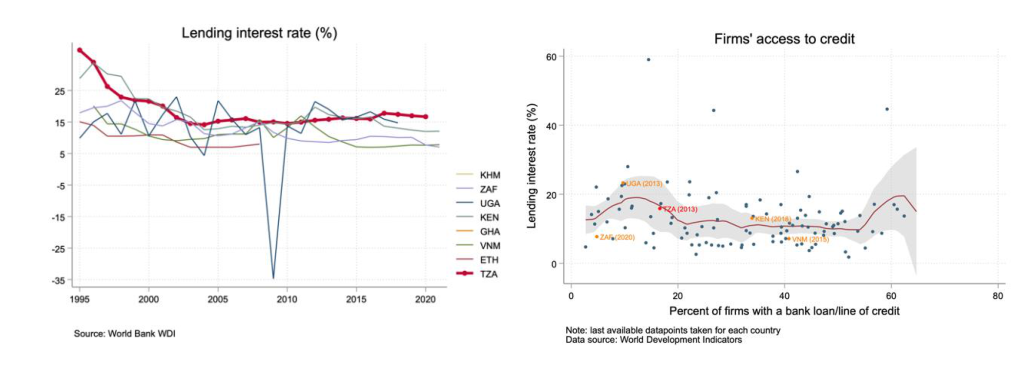
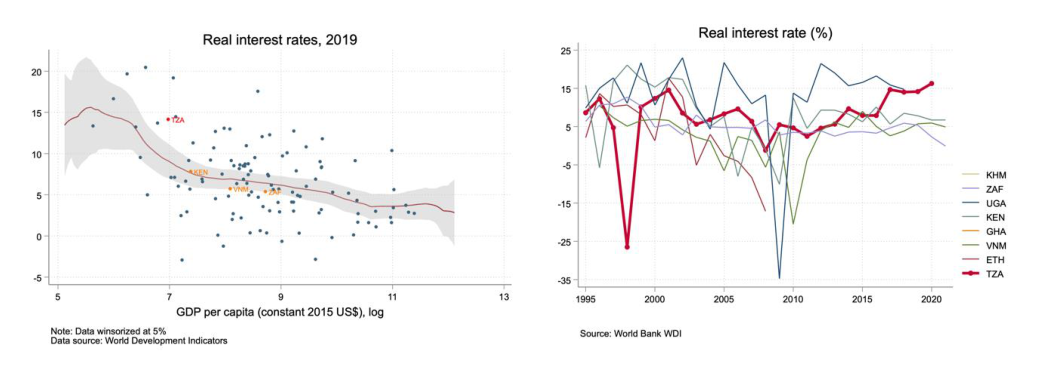
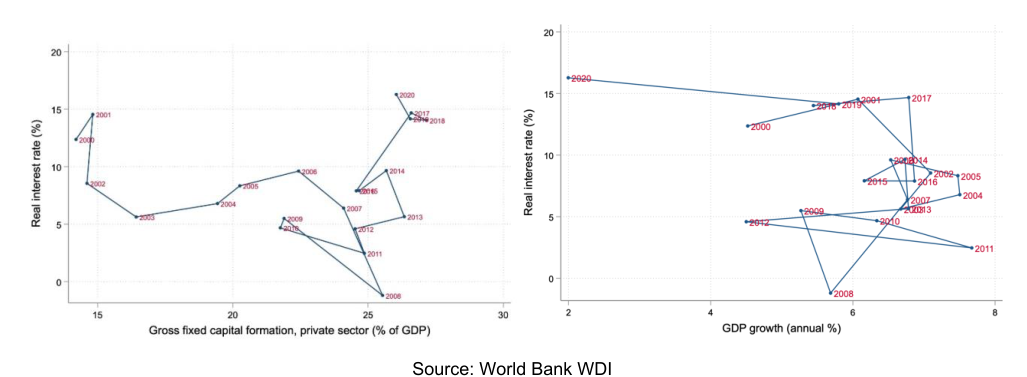
To complement the signal of high real interest rates, we examine if movements over time of the price of finance are associated to the dynamics of investment. If a factor is binding, movements in the factor should be associated to movements in the objective function – investment and growth. That principle in Tanzania does not seem to hold for the cost of finance, as lower interest are not correlated neither with higher investment (as measured by gross fixed capital formation) nor with economic growth (Figure 28). Historically, total investment has grown despite the real interest rate dynamics and there is only a slightly negative correlation between real interest rates and GDP growth, mostly driven by COVID-19-affected 2020. If that rather exceptional period is removed, there is no meaningful association between these variables.
Report Growth Diagnostics and Competitiveness Study of the Manufacturing Sector in Tanzania 29
Figure 28: Movements in real interest rates vs. investment
Source: World Bank WDI Considering the quantity of finance, we do not observe a link between expansions in domestic credit and economic growth. From 2005 to 2015 credit to the private sector as a share of GDP grew two-fold from 7.4% to 14.6%, while GDP growth averaged 6.3% annually. That pace is similar to the growth recorded from 2015 onwards (5.3% annually) when credit to GDP was declining from 14.6% in 2015 to 13.1% in 2020. Furthermore, there is little correlation between the annual movements of these variables (Figure 29): while GDP growth had little to no volatility over the 2000-2019 years (averaging 6.3%; standard annual deviation under 1%), the domestic credit growth averaged 35% per year in the period before the GFC (2002-2008) and 17.5% during the 2009-2019 period.
Figure 29: Domestic credit and GDP growth in Tanzania
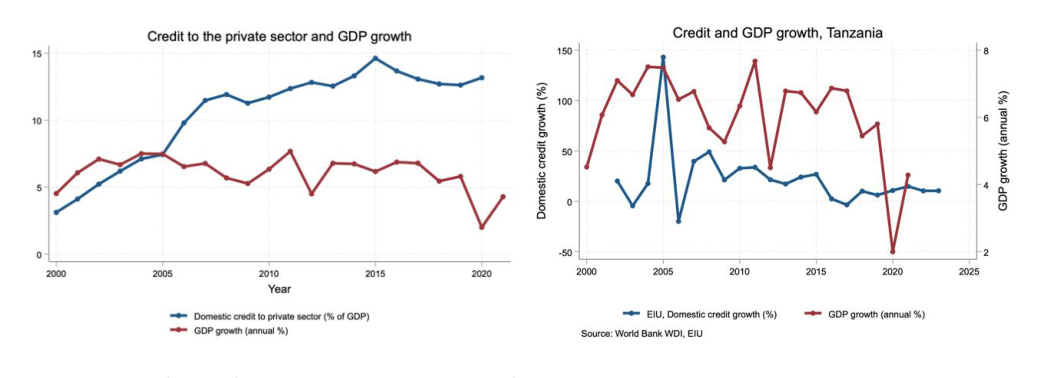
Source: Own elaborations based on Bank of Tanzania, and the Economist Intelligence Unit.
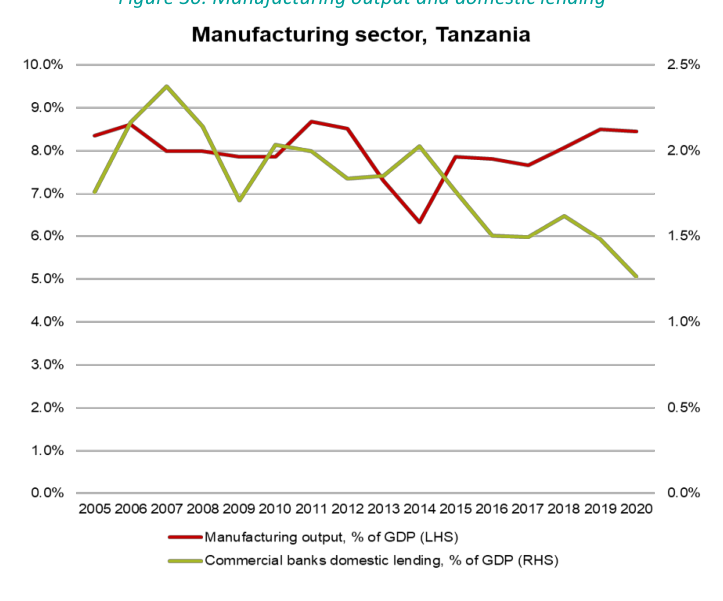
The lack of correlation between access to credit and output holds when we zoom in on the dynamics for the manufacturing sector. Figure 30 shows the two series plotted together over the period of 2005-2020. While there is no discernible correlation between these variables between 2005 and 2015, from 2015 onwards the correlation turns negative, with manufacturing output expanding amidst a significant decrease in provision of funds from the local banking system. At the same time, when credit grew the fastest (2005-2007, 2013-2014), manufacturing output either stagnated or decreased.
Report Growth Diagnostics and Competitiveness Study of the Manufacturing Sector in Tanzania 30
Figure 30: Manufacturing output and domestic lending
Source: Own elaborations based on Bank of Tanzania, National Bureau of Statistics.
Given that decreases in interest rates and increases in credit availability do not seem to be associated with changes in economic growth or manufacturing output, we conclude that access to finance is not the most binding constraint. These dynamics suggest that reductions in interest rates and increases in domestic credit would not unleash activity in the manufacturing sector, and that Tanzania ’s challenge s are more likely to entail low social returns on investments rather than an inability to finance them. Nevertheless, before moving to the low returns side of the diagnostic tree, we will examine the drivers of the cost of finance in Tanzania. Given that real interest rates are high, and firms do complain about access to finance, it is quite possible that as other economic constraints are lifted and returns rise, access to finance becomes more binding.
2.1.2. Credit Supply – Savings and access to international capital markets
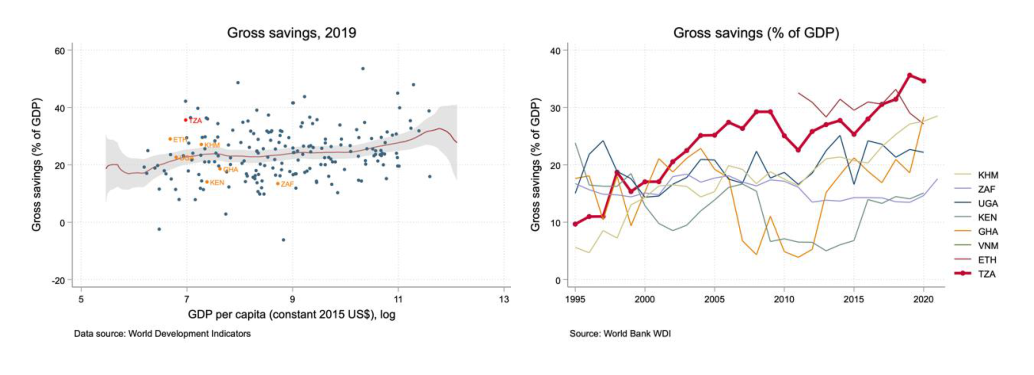
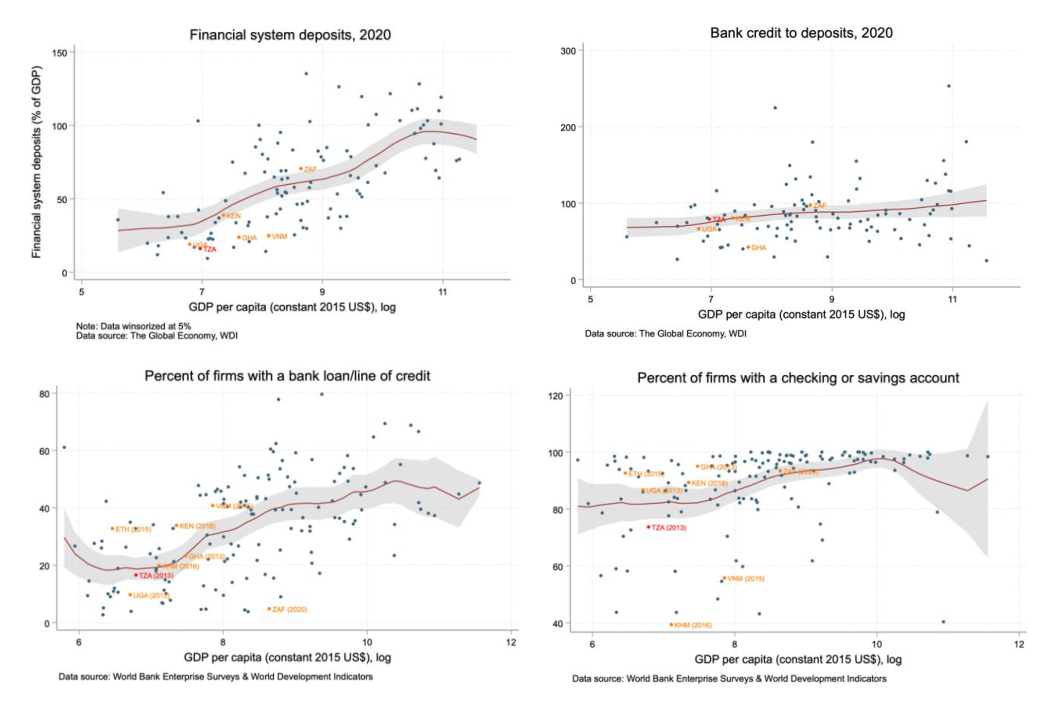
Gross domestic savings are among the highest for Tanzania’s level of income and among peers, but savings do not make it into the financial system. Savings (income minus consumption) have been at adequate levels for a long time (Figure 31). At the same time, several measures of financial depth such as deposits in the financial system and firms’ access to credit through a loan or a line of credit, strongly suggest that Tanzanian firms have less access to credit relative to peers and income level ( Report Growth Diagnostics and Competitiveness Study of the Manufacturing Sector in Tanzania 31
Figure 32 ). While deposits are low, the ratio of bank credit to deposits seems to be in line with what’s expected, suggesting that lack of credit is driven by low deposits in the financial system rather than the system’s ability to turn deposits into credit. Financ ial connectedness, measured through general bankarization rates, is also low relative to peers and for Tanzania’s level of income. Just over 70% of firms own a savings account on average, a number even lower for the manufacturing sector ( Figure 32 ) 18 . While more recent data on the proportion of financially connected firms is not available, qualitative evidence gathered during field trips to Tanzania suggests that the number is growing due to territorial expansion of banking services to the remote areas and the introduction of mobile banking.
Figure 31 : Tanzania’s gross domestic savings
One of the potential explanations for savings not entering the financial system is the strong prevalence of cash in the economy. Anecdotal evidence collected on the ground through interviews with the private sector (manufacturing firms) and financial sector (commercial banks)
Report Growth Diagnostics and Competitiveness Study of the Manufacturing Sector in Tanzania 32
suggests that there’s a common preference for people in some sectors such as seasonal farming to keep money in cash and transact with their counterparts bypassing the banking system. The size of the mismatch would imply that the size of the cash economy is around 20% of GDP 19 . This estimate can be used to shed light on whether the cash economy is directly linked with the shadow economy. IMF and World Bank research on the shadow economy worldwide suggests that Tanzania is indeed a highly informal economy. Schneider et al (2010) rank Tanzania 4 th among 88 developing countries with a shadow economy of around 57% of GDP on average in 1999- 2006 20 , only lower than Peru, Panama, and Bolivia 21 . Some more recent estimates indicate that even though informality had scaled back, the shadow economy was still above 30% in 2015 (Schneider et al., 2018). At the same time, the money multiplier values do not seem abnormally low, with Tanzania’s monetary base to broad money ratio ranked in the middle of its peer group 22 .
Figure 32 : Tanzania’s financial system: Deposits, credits and ban karization
Report Growth Diagnostics and Competitiveness Study of the Manufacturing Sector in Tanzania 33
Another reason potentially driving the mismatch between low credit and high investment might be the local design of industrial policy and trade protectionism. If domestic firms are making excess returns from their investments due to protection, they might be generating enough income to finance investment internally via retained earnings. This would imply that growth would be concentrated among large incumbents who would have a virtual monopoly on high-return investments in manufacturing.
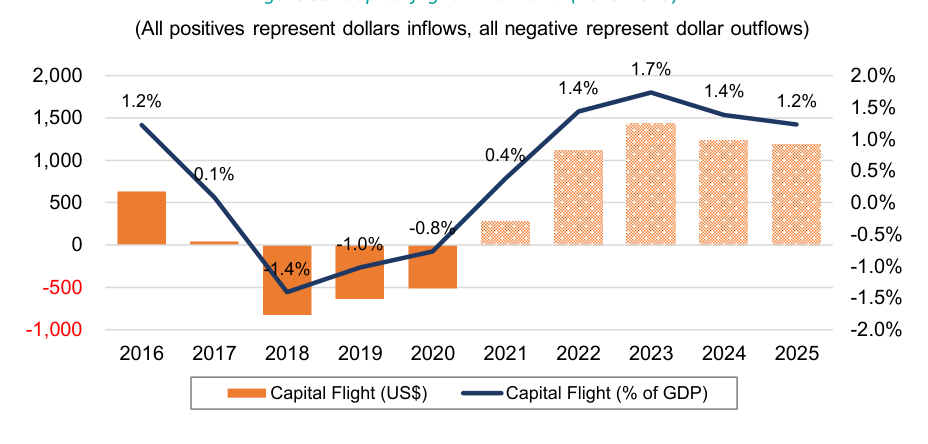
Capital flight does not seem to be driving the savings-deposits mismatch. If savings are transferred abroad in the form of financial assets acquisition, loans, and dividends, they would not make it into the domestic financial system. To track that, we estimated Tanzania’s capital flight based on its balance of payments and relying on Carlos Diaz-Alejandro (1985). The results (reported in Figure 33) suggest that there was some capital flight recorded between 2018-2020, but the size cannot possibly explain the savings-deposit mismatch and, in any case, has reversed from 2021 onwards.
Report Growth Diagnostics and Competitiveness Study of the Manufacturing Sector in Tanzania 34
Figure 33: Capital flight in Tanzania (2016-2025)
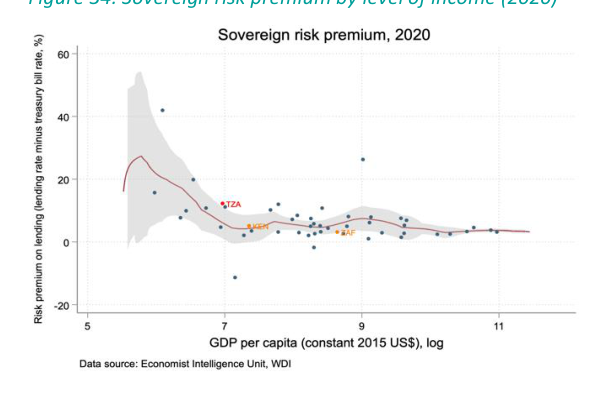
Source: Own elaborations based on IMF data Beyond domestic savings, banks and large corporations should be able to access international financial markets to finance their investments. Access to international financial markets can be assessed by premiums on sovereign bonds and credit default swaps (CDSs) 23 , with the latter not being available for Tanzania. Sovereign risk premiums have been high and volatile. Moreover, they have been trending upwards, recording the worst deterioration for Tanzania, and placing the country at the bottom of its peers. Tanzania’s opportunities to borrow abroad were historically limited due to sovereign credit rating absence up until 2018 when it was assigned for the first time for localand foreign-currency issuances. While in 2020, Moody’s Investors Service gave the Government of Tanzania a rating of B1 with a negative outlook due to “low institutional and fiscal strength” 24 , the most recent rating from April 2023 was B2 positive. Thus, despite a positive outlook, there is a potential shortage of access to international finance, even though there are many potential instruments available, such as ESG or infrastructure bonds.

Report Growth Diagnostics and Competitiveness Study of the Manufacturing Sector in Tanzania 35
2.1.3. Financial Intermediation
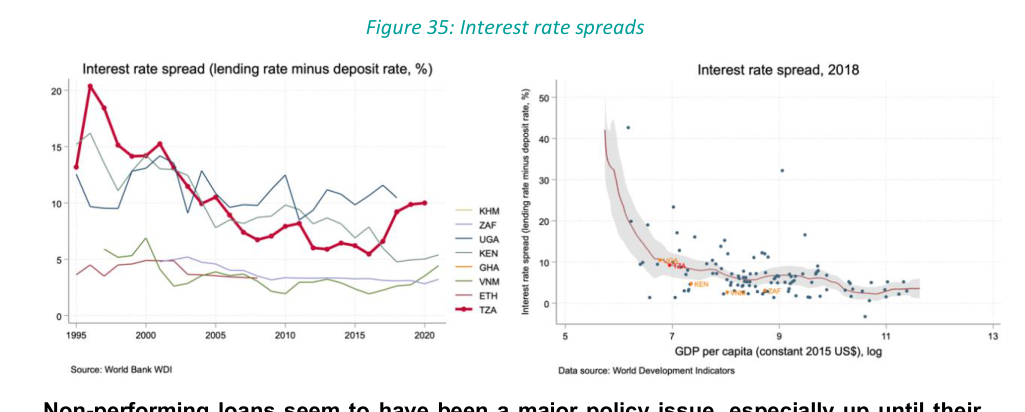
Tanzania does not record large financial intermediation costs, but lending-deposit spreads are among the highest among peers and point to potential inefficiencies in the banking system. The spread between the average lending rate and the average deposit rate is higher than in most of the benchmark countries for which data is available (Figure 35). In 2018, Tanzania ranked second highest among benchmark countries, only better than Uganda. Moreover, the lending and deposit rate spread appears to be growing in recent years, going from around 5% in 2016 to 10% in 2020, with the spread mostly being driven by the changes in the deposit rates, with lending rates fluctuating very little around 15%. Indeed, in the more recent period (from 2016 onwards), which corresponds to the non-performing loans stress (see next paragraph), financial intermediation was likely problematic, as reflected in higher spreads. Yet, even if relatively high, interest rate spreads in Tanzania are not outliers for its level of income (Figure 35).
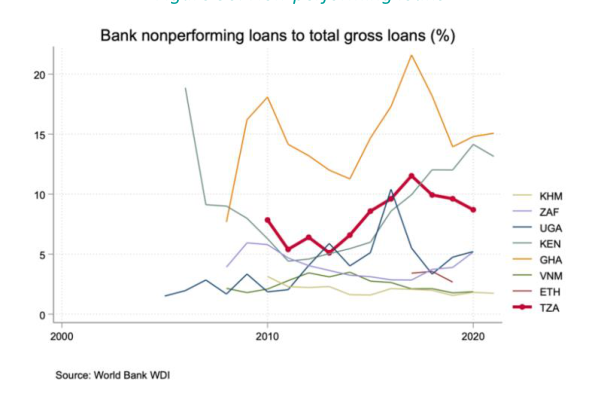
Non-performing loans seem to have been a major policy issue, especially up until their peak in 2017, and may still have lingering effects in the form of restrictive underwriting and regulatory practices. In 2020 the share of non-performing loans to total gross loans stood at 8.7% – down from around 12% in 2017 – at intermediate compared to peers but generally high (Figure 36). Due to the lack of data, it is impossible to test how non-performing loans behaved during the first wave of credit expansion of 2000-2010, when credit to the private sector jumped from less than 5% to more than 10% of GDP. Qualitative interviews point to the fact that the Global Financial Crisis of 2008 aggravated the issue of non-performing loans in the economy (up to 15- 16% for individual banks), which affected value chains in the whole productive economy including manufacturing. In subsequent years, non-performing loans almost doubled from below 7% in 2009 25 to almost 12% in 2017, accompanying the second wave of credit expansion of 2010-2015. Qualitative evidence suggests that the Bank of Tanzania took measures to contain the issue, such as implementing risk-based prudential requirements, ensuring banks report credit information to credit reference systems, and urging them to enhance credit underwriting standards, as well as recently allowing credit refinancing and restructuring during the COVID-19 shock (which lasted well into December 2022). These policies pushed the existing non-performing loans values further down, to the neighborhood of around 3% for individual banks and 6% for the whole economy 26 . However, this might raise concerns about the sustainability and financial health of the current portfolio of loans that graduate from the restructuring programs.
25 Data taken from the Bank of Tanzania’s Financial Stability report from Sep tember 2010, accessed at: https://www.bot.go.tz/Publications/Filter/4 . The discrepancies in the NPLs data exist between the World Bank’s WDI and Bank of Tanzania’s publicly available data, however, it is within 2 percentage points reach and it might arise due to Ban of Tanzania’s calculations of NPLs that for some years only include data from Top Ten Banks. 26 Bank of Tanzania, Monetary Policy Statement, Mid-year Review 2022/23.
Report Growth Diagnostics and Competitiveness Study of the Manufacturing Sector in Tanzania 36
Figure 36: Non-performing loans
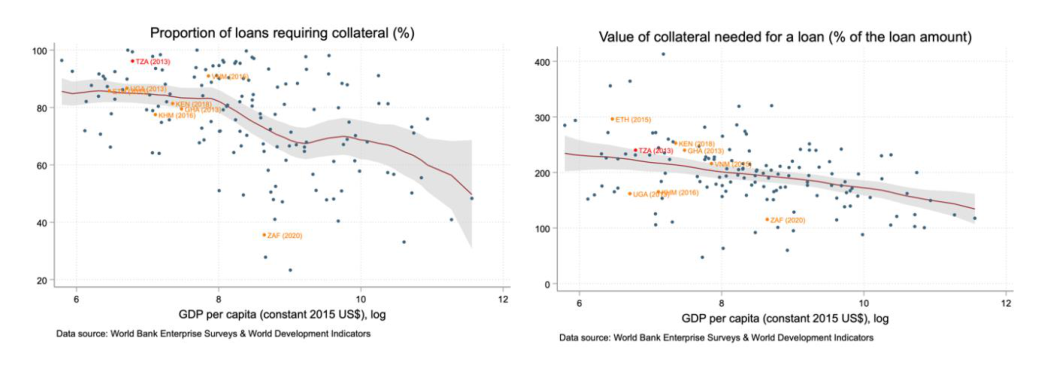
Qualitative interviews with firms in Tanzania suggest that spillovers from the nonperforming loans problem still impact financial intermediation today. For example, credit is rationed through stringent collateral requirements, in terms of the proportion of loans requiring collateral and the value of collateral itself. Both indicators are higher than expected for Tanzania’s level of income (Figure 37). This is especially true for manufacturers. Although the share of loans requiring collateral remained steady over the years, the percentage of firms with a loan decreased from 22.2% to 18.7% (Table 1) 27 . However, there were some improvements in terms of percent of firms using banks to finance investments, which grew from 11.2% in 2006 to 25.4% in 2013, and in the proportion of investments financed by banks, which went from 12.1% in 2006 to 15.9% in 2013. At the same time, the value of collateral needed for a manufacturing firm in 2013 (272%) doubled with respect to 2006 (146.2%) and was consistently higher than that of an average firm throughout the observed period. As the banking system is fully collateralized, it restricts the number of firms with access to bank credit, particularly in the sectors without sufficient assets (for example services). Another factor driving strict collateral requirements is related to challenges for collections and bankruptcy litigations in the legal framework, making collateral heavily discounted, as stressed by representatives from the largest Tanzanian commercial banks.
Figure 37: Loan collateralization: share of total and values
Report Growth Diagnostics and Competitiveness Study of the Manufacturing Sector in Tanzania 37
Table 1: Manufacturing firms in Tanzania
2006 2013 Percent of firms with a checking or savings account 83.4 70.3 Percent of firms with a bank loan/line of credit 22.2 18.7 Proportion of loans requiring collateral (%) 97.2 97.3 Value of collateral needed for a loan (% of the loan amount) 146.2 271.9 Percent of firms not needing a loan 17.7 22.3 Percent of firms whose recent loan application was rejected . 5 Percent of firms using banks to finance investments 11.2 25.4 Proportion of investment financed internally (%) 81.4 78 Proportion of investment financed by banks (%) 12.1 15.9 Percent of firms using banks to finance working capital 24.9 18.9 Percent of firms using supplier/customer credit to finance working capital 72 26 Proportion of working capital financed by banks (%) 7.3 6.9 Percent of firms identifying access to finance as a major constraint 43.4 64.7 Source: World Bank Enterprise Surveys.
At the same time, it doesn’t seem that tight collateral requirements and other forms of credit rationing are the direct result of the strict policy and banking sector regulation imposed by the Bank of Tanzania, as banking regulation and rules enforcement do not seem to be particularly strong. Despite the market liberalization reforms in the mid-1990s, banking regulation was characterized by informal commitment with international organizations, a slow-paced application, and low enforcement of Basel standards until the late 2000s. In part, this pattern was a combination of lax interest of regulators and the incidence of favorable financial results for foreign and international banks delaying their implementation (Gray, 2020). However, since 2009 the Bank of Tanzania has prioritized the adoption of the standards, partially accelerated by the East African Community (EAC) harmonization, the global financial crisis, individual use of international standards by foreign banks, and IMF recommendations. Currently, risk-based supervision has taken more relevance by combining a transition to a selective adoption of Basel II and III with local banking standards. Better alignment with international regulation has improved the banking system in the last decade. However, the partial and tailored implementation persists as problems for the non-performing loans levels and small banks under-capitalization.
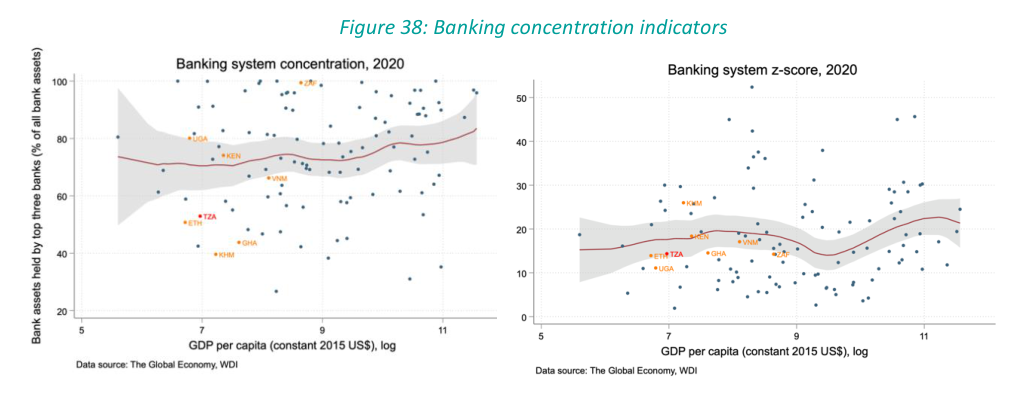
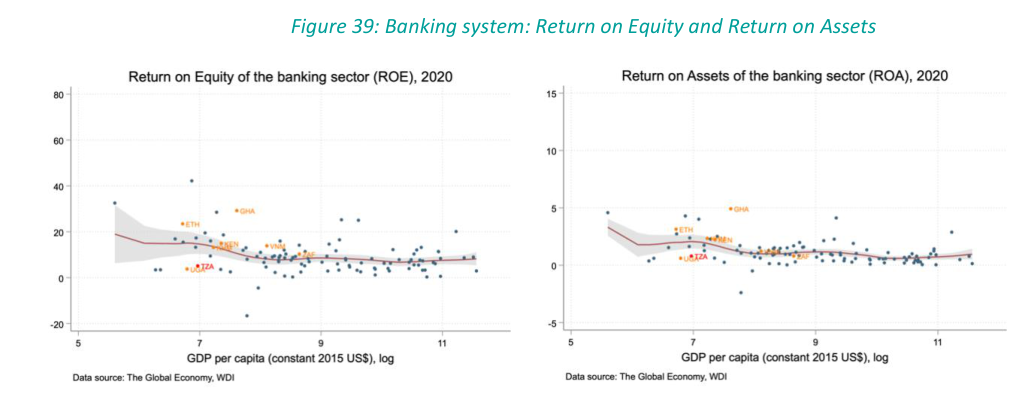
The banking sector’s headline indicators suggest that the sector’s financial health is better than what one would expect for its level of income. Banking system concentration is on par with most peers and below many countries at the same income level in 2020 (Figure 38). Absence of high concentration ensures competition between banks. Indeed, Tanzania’s banking sector’s profitability indicators, namely ROE and ROA, are among the lowest in the peer group, which is consistent with the high competition hypothesis (Figure 39). However, low returns might also point to the fact that the sector is not very efficient, since some of the problems include “insufficient loan loss provision, undercapitalized banks, and high balance sheet dollarization” 28 . At the same time, there are no vivid risks of systemic problems, as the probability of default, measured by the banking system Z-score, is low both in absolute terms and compared to peers (Figure 38).
Report Growth Diagnostics and Competitiveness Study of the Manufacturing Sector in Tanzania 38
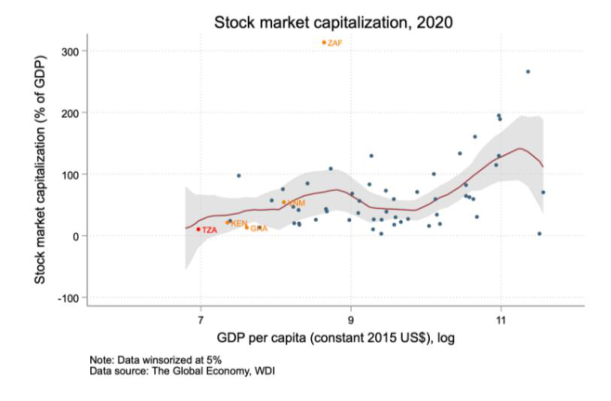
The analysis of bank lending above is important because Tanzania’s equity and bond markets are underdeveloped. As seen in Figure 41 stock market capitalization relative to GDP has been below all peers for which data is available, averaging 10% of GDP by 2020. Similarly, according to the Economist Intelligence Unit’s data, corporate and international bond issuance stood virtually at 0 as of 2020. These numbers were backed by the interviews on the ground: both firms and commercial banks pointed to the fact that it is very hard to attract money through any non-traditional sources (such as venture capital) and that commercial banks are often perceived as investment banks, which creates a disconnect between their preferred balance sheet approach to investing and what is expected from them by the actors in the economy. The deepening of equity and bond markets may not be a binding issue now but is an important area of financial intermediation that the country will need to work on in the coming years.
Report Growth Diagnostics and Competitiveness Study of the Manufacturing Sector in Tanzania 39
Figure 40: Stock market capitalization
An overview of financial intermediation has revealed that while the banking sector is not in immediate distress, financial intermediation in the country requires significant improvements. An issue of collateral and high lending rates, not responsive to any monetary policy changes, poses stress on demand for borrowers, while banks’ inefficiencies limit firms’ access to their services. The World Bank FSDA report gives a clear set of policy improvements to fix these issues which are ready for implementation, particularly, advice on capital market development and banks’ ability to raise money, along with reforms tackling legal system inefficiencies for bankruptcy and collateral collection.
In summary, there is sufficiently strong evidence to conclude that the supply of finance is not a binding constraint for the manufacturing sector in Tanzania . It is not the case that only sectors that need little finance are able to thrive in the country, in fact the opposite is the case. Tanzania is surprisingly capital intensive for its level of income, and the segments of the broader economy and of the manufacturing sector in particular that are more intensive in finance tend to be larger and grow faster. Most tellingly, decreases in the cost of finance and increases in the supply of finance to the private sector do not bring about increases in growth, neither for the economy broadly nor for the manufacturing sector.
This does not mean that all is well in the country’s financial system . Though Tanzania enjoys stable macroeconomic indicators and a high savings rate, these savings do not make it into the financial system, likely due to a large cash-based informal economy, and result in low levels of credit to the private sector despite a reasonably competitive banking system. Financial intermediation is not terribly efficient and requires improvements, and access to international finance is quite limited. As a result, real interest rates are persistently high, and the limited supply of credit is a common complaint of firms in the country. It is particularly harmful to those who can’t finance internally through retained earnings from their larger domestic or foreign business group. Despite these deficiencies, there is insufficient evidence to suggest that improvements to financial intermediation and access to external finance, though necessary, would unleash accelerated growth in manufacturing output in Tanzania.
Report Growth Diagnostics and Competitiveness Study of the Manufacturing Sector in Tanzania 40
2.2. Low social returns – Infrastructure
This section provides a high-level analysis of infrastructure as a part of the low returns to economic activity branch of the Growth Diagnostics tree , examining if different types of infrastructure are likely to represent a constraint to Tanzania’s economic growth and the manufacturing sector’s development. A high -level review of transportation infrastructure (roads, rail, ports, and air) and communication networks is followed by a deep dive into electricity and general power supply issues as a potential constraint.
2.2.1. Transportation
Transportation infrastructure is particularly important for Tanzania given its strategic location in East Africa. The country has direct access to the Indian Ocean with a 720 km long coastline and borders eight other nations six of which are landlocked: Uganda, Rwanda, Burundi, Democratic Republic of Congo (DRC), Malawi, and Zambia. The transport infrastructure therefore not only supports domestic connectivity but intraregional as well with important implications to trade and economic integration. The transport and storage sector contributed 7.8% to the country’s real GDP in 2021, a total of USD 10 billion (constant 2015) according to the Central Bank of Tanzania and has shown a significant increase in the past decade, growing at an average rate of 6.43% since 2012.
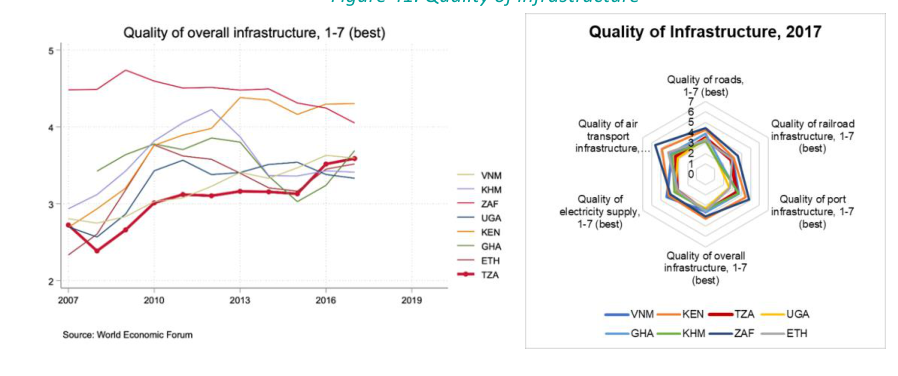
Tanzania ranks in the middle with respect to comparator countries, steadily increasing its overall ranking in quality of infrastructure indicators. The country has an average ranking of 3.5 (of 7) and ranks just below Kenya, South Africa, and Ghana (Figure 41). Quality of infrastructure has been improving overall, particularly driven by improvement in the quality of roads and railroads since 2007, but with port and air transport infrastructure also seeing significant increases. While the quality of air transport infrastructure ranks the lowest among peers and saw some declines in 2013, it has been back to an upward trajectory since 2014 (Figure 41).
Figure 41: Quality of infrastructure
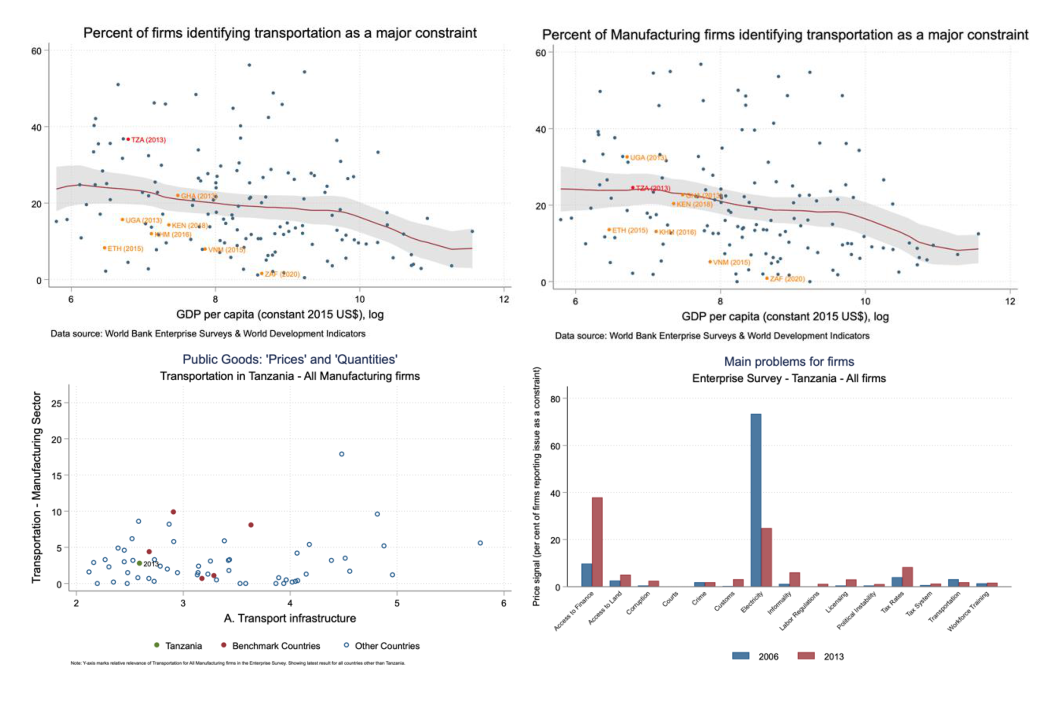
A significant share of companies in Tanzania perceive transportation as a constraint, though its importance relative to other obstacles has declined. Despite improvements in quality, 40% of all firms in the economy and a fifth of companies in the manufacturing sector identify transportation as a major constraint, the highest among peers (Figure 42). That said, the rate is in line with Tanzania’s GDP per capita and the overall transport infrastructure score. Moreover, the share of firms choosing transportation as their biggest constraint has remained low, and this is the case for all firms and the manufacturing sector specifically (Figure 42).
Report Growth Diagnostics and Competitiveness Study of the Manufacturing Sector in Tanzania 41
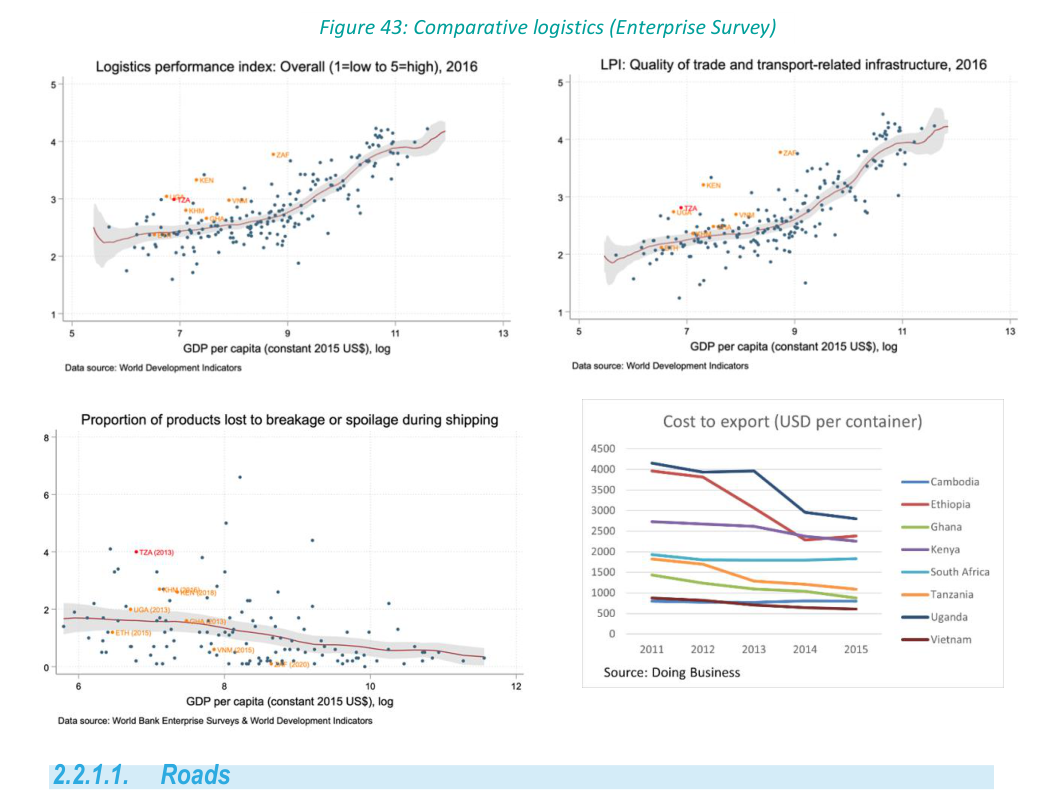
In terms of logistics, Tanzania performs well, though there is some evidence of inefficiencies. Tanzania ranks fourth among peers in the Logistics Performance Index (LPI) and is significantly above trend with respect to its GDP per capita. Tanzania performs even better with respect to the quality of trade and transport-related infrastructure, ranking only below Kenya and South Africa, and significantly above trend for its GDP per capita (Figure 43). Furthermore, the cost to export has gone down in the past years, highlighting improvements. At the same time, however, the country also has an unusual share of products lost to breakage or spoilage during shipping (Figure 43). Though the absolute figure is low (around 4%), it is the highest compared to peers, signaling some inefficiencies.
Tanzania has made significant strides in transport infrastructure which renders infrastructure an unlikely candidate to be the most binding constraint. Overall, Tanzania seems to have made significant strides in improving the quality of transport infrastructure and while there are some inefficiencies and room for improvement, especially regarding air transport, the country does not seem to be performing significantly worse off than its peers. The improvements in transportation infrastructure over the recent decades have not brought about an unleashing of manufacturing output that would increase its share of GDP, further supporting the conclusion that it is not a binding constraint. The next sections deal more in depth with each of the components of transportation infrastructure.
Figure 42: Comparative Perceptions on Logistics (Enterprise Survey)
Report Growth Diagnostics and Competitiveness Study of the Manufacturing Sector in Tanzania 42
Tanzania’s road infrastructure is crucial for the mobility of people and goods within and between regions and cities, as it is the dominant mode of transportation in the country. R oads are claimed to be used for “carrying over 90% of the passengers and 75% of freight traffic in the country” 29 . Thus, the coverage and quality of Tanzania’s road network may have a large impact on daily intra-regional and urban movements. While the coverage consists of more than 86,000 kilometers (km) of roads, Tanzania has one of the lowest road densities in the region, with only about 8.9 km of road per 100 square km of land. Although that is above the African average, it is also the lowest among peers. 30 The roads are divided into national roads (around 40% of all roads, managed by TANROADS), with the rest being attributed to urban or district roads, under the supervision of the Prime Minister’s Office Regional Administration and Local Government. 31 Even though there have been recent efforts to improve the road network, including the construction of new highways and the upgrading of existing roads, the road infrastructure needs further enhancement. While the Quality of Roads index has been reported to grow consistently over the years – starting from below 3 in 2007 and going to 4 in 2019, making Tanzania third in terms of road quality among its peers (Figure 44) – anecdotal evidence suggests that the majority of roads in the country are unpaved and in poor condition, which can make travel difficult and slow. At the same time, Tanzania ranks in the middle of the peer group in terms of the World Economic Forum’s Road Connectivity Index, 32 but above the median for Sub-Saharan Africa (Figure 44).
29 See the following link . 30 See the following link . 31 See the following link . 32 See the following link .
Report Growth Diagnostics and Competitiveness Study of the Manufacturing Sector in Tanzania 43
Figure 44: Road infrastructure
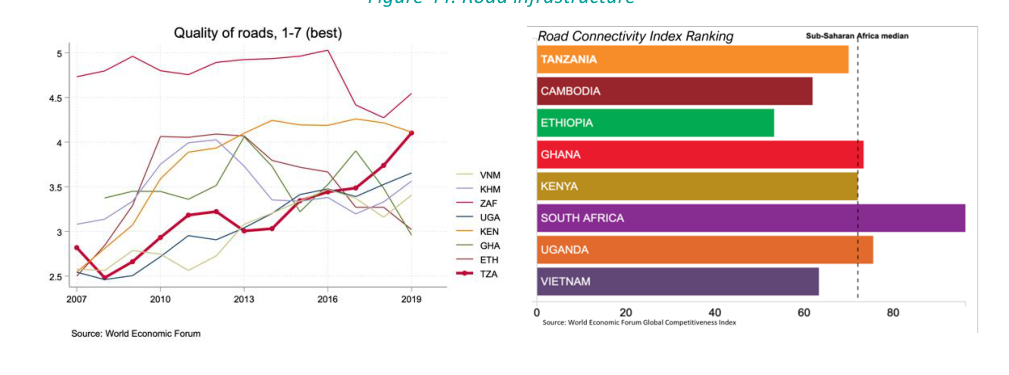
2.2.1.2. Railways
Tanzania also has a significant rail network infrastructure, which is deemed critical for long-distance freight along the main transport corridors of the country. Rail networks have an estimated 3,676 km of railway lines and are operated by two systems: the Tanzania Railways Corporation (TRC) and Tanzania-Zambia railways (Tazara) which link the country to Uganda and Kenya as well as Zambia, respectively 33 . The country moved from a score of 2 in 2014 to 3 by 2017, ranking fourth among peers, but does not have railway infrastructure to connect it with its other five neighboring countries. In terms of ranking, Tanzania ranks above Cambodia, Ghana, and Uganda and above the Sub-Saharan Africa median (Figure 45).
The government of Tanzania has made efforts to increase railway connectivity as part of efforts to strengthen intraregional connectivity. In December 2022, the government of Tanzania awarded a USD 2.2 billion contract for the final section of the Standard Gauge Railway which will connect the port of Dar es Salaam to Lake Victoria where a large share of intraregional trade occurs. The completed project would add 2.561 km of rail lines and would complement the existing railroad infrastructure by eventually reaching Burundi, DRC, Uganda, and Rwanda. It is expected to lower transport costs, with DRC by at least a third (from USD 6.000 per ton to USD 4.000), thus making a step forward in facilitating cross-border trade. 34
Figure 45: Railroad infrastructure
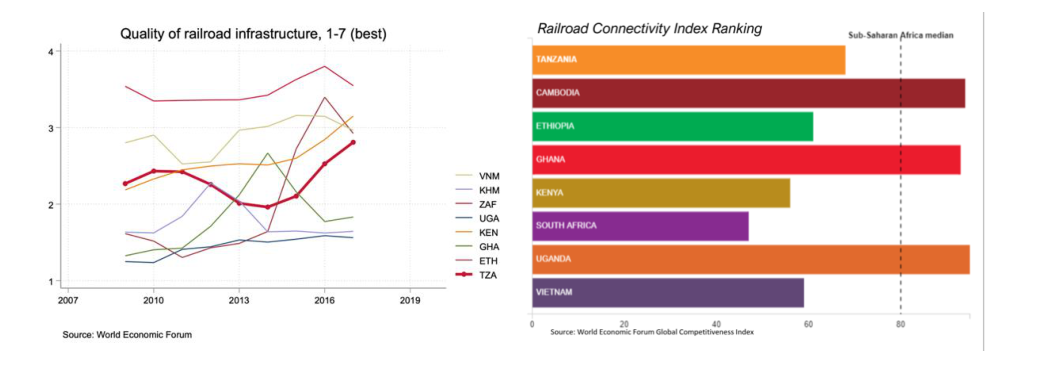
33 See the following link . 34 See the following link .
Report Growth Diagnostics and Competitiveness Study of the Manufacturing Sector in Tanzania 44
2.2.1.3. Ports
Because of Tanzania’s strategic position in Eastern Africa and a large coastline along the Indian Ocean, the country’s waterway infrastructure is significant. Tanzania’s waterways serve several landlocked neighbors (including Rwanda, Burundi, Uganda, and the DRC) thus playing a strategic role in regional trade integration. Between 2015-2020, the volume of trade for these countries handled at Tanzania’s ports increased from 13.7 million to 16 million metric tons – a 16.6% increase 35 . State-owned Tanzanian Port Authority (TPA) is in charge of managing the ports and waterways of the country since 2005 and has worked continuously on expanding and improving the infrastructure.
Tanzania has three major seaports, the largest of which being the Dar es Salaam port ha ndling more than 90% of the country’s international maritime trade and a cargo capacity of over 10 million tons 36 . Dar es Salaam is the fourth biggest facility on Africa’s Indian Ocean coast and is in competition with Kenya’s Mombasa port as the leading ma ritime hub in East Africa. Alongside Dar es Salaam, the ports of Tanga and the Mtwara service the Eastern coastline. The Tanga port is near the Kenyan border in Northern Tanzania and is the second largest port in the country with a cargo capacity of 1-2 million tons. Meanwhile, the Mtwara port is located in southern Tanzania near Mozambique and also serves Malawi and Eastern Zambia. As the third largest port, it has a cargo capacity of approximately 750.000 tons. The Mtwara port operates at a much lower capacity than the Dar es Salaam and Tanga ports. The seaports mainly support the export activities of the agriculture sector and the metals industry.
Given Tanzania’s strategic location within the Great L akes’ region, the country also has a significant number of lake ports that connect to landlocked countries . Inland waterways infrastructure serves Lake Victoria, Lake Nyasa, and Lake Tanganyika. The Mwanza port is the largest maritime facility serving Lake Victoria connecting the country to Uganda while the Kigoma, Kasanga, and Kyela ports in Western Tanzania serve as a key connection route to Malawi, Burundi, Rwanda, Zambia, and the DRC 37 .
Tanzania’s port infrastructure has been expanding, but still sta nds to gain much more significantly as a key strategic location for the East African region, especially in a context where regional integration is increasing. The quality of port infrastructure has been increasing, albeit at a slower pace than ground infrastructure, remaining just below 3.5 points since 2011, highlighting room for further investment. The country ranks just above Ethiopia and Uganda according to the World Economic Port Competitiveness Index though with a higher ranking than the Sub-Saharan Africa median (Figure 46) 38 . As interest in expansion and concerns over congestion rise, the country has plans for additional port infrastructure. This includes a port near Dar es Salaam with the objective of helping ease the congestion at the country’s largest port. Moreover, impro vements in Dar es Salaam’s port using a combination of government funding, World Bank, and the Foreign Commonwealth and Development Office of the United Kingdom (FCDO), have led to gains in efficiency. At the same time, however, during the interviews on the ground firms still reported the capacity being insufficient in the Dar es Salaam port, with the expansion of docks and other facilities (such as cooling spaces for perishable goods) being slow.
35 See the following link . 36 See the following link . 37 See the following link . 38 See the following link .
Report Growth Diagnostics and Competitiveness Study of the Manufacturing Sector in Tanzania 45
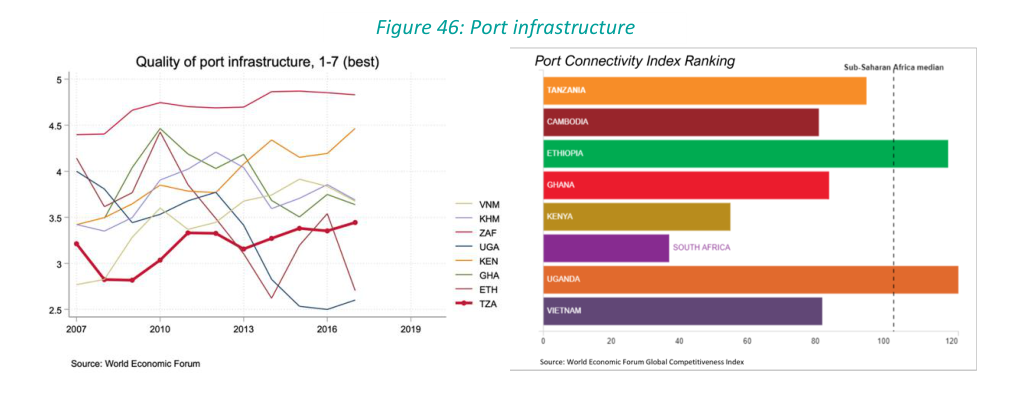
2.2.1.4. Air transport
Tanzania’s air transport infrastructure stands the most to gain from new investments. The quality of air transport infrastructure is the second to lowest among peers, only above Uganda, and ranks overall worse than the Sub-Saharan Africa median. That said, the quality of air transport infrastructure has been back on an upward trajectory since 2014 moving from a score below 3 to just about 3.5 (Figure 47).
Figure 47: Air transport infrastructure
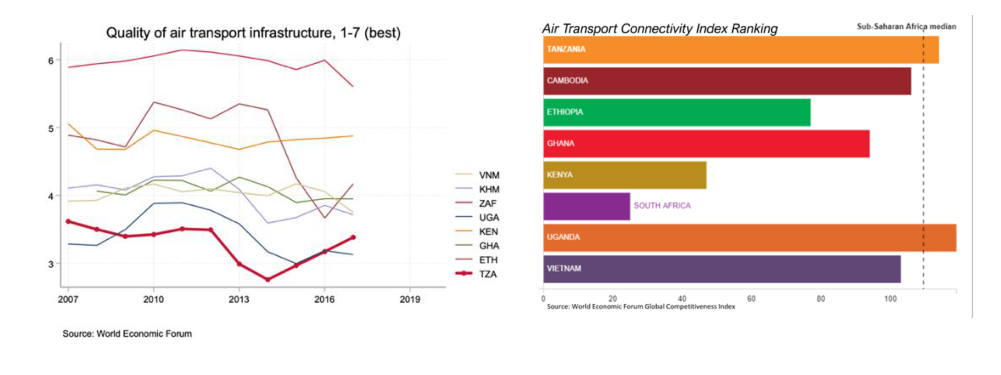
Tanzania has many airports, however not all are utilized at full capacity. 58 airports operate in Tanzania, managed by the Tanzania Airports Authority (TAA). The Julius Nyerere International Airport (JNIA) in Dar es Salaam is the largest airport and serves over 70% of the country’s air passengers. The Kilimanjaro, Zanzibar, and Arusha airports follow with a significant proportion of international travelers. Of the rest, only 15 transport more than 2.500 passengers a year. The number of air passengers has increased significantly from 5.2 million in 2015 to 6.2 million in 2019 – an increase of 18% 39 .
Air cargo capacity is highly concentrated as well. The JNIA airport is also the largest player carrying 89% of all air freight shipping. Total air freight reached just under a million tons-km in 2019 40 . Imported cargo represents 90% of all cargo, of which a third is machinery and electronics. In terms of exports, air cargo transports animal products, machinery, and metals as well as fish 39 See the following link . 40 See the following link .
Report Growth Diagnostics and Competitiveness Study of the Manufacturing Sector in Tanzania 46
products 41 . In line with efforts to boost the sector, the Ministry of Works and Transport has announced fresh investments for the air transport sector for 2023-2024 seeking to expand coverage domestically and a particular focus to bringing airport infrastructure up to international standards 42 .
2.2.2. Information technologies and telecommunications
Tanzania’s telecommunications infrastructure efforts to expand access have accelerated as the country has focused on expanding 5G adoption. Adoption of 4G had been slow given the high costs relative to average income levels but 5G adoption presents a particular opportunity to increase digital penetration. Tanzania is one of 10 African countries to have incorporated 5G technology per a recent Ecofin Agency report 43 , with The Tanzania Communications and Regulations Authority (TCRA) regulating and overseeing the sector.
Continuing investments in telecommunications could help Tanzania overcome its lag in technological adoption. Tanzania lags in both adoption of mobile telephone subscriptions as well as broadband and access to internet. In terms of mobile telephone subscriptions, Tanzania has 85 mobile subscriptions per 100 people, only above Ethiopia and Uganda and below what trend with respect to its income per capita (Figure 48).
Figure 48: Telecommunications infrastructure
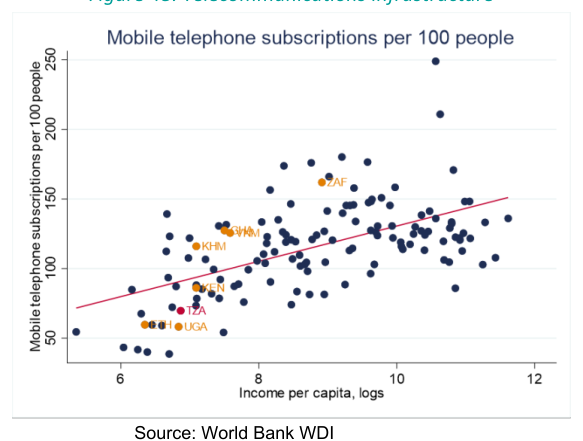
Source: World Bank WDI In terms of fixed broadband subscriptions, Tanzania had only 1.95 subscriptions per 100 people by 2021, ranking in the middle versus comparator countries but above the Sub-Saharan Africa average of 0.76. It lags further behind in terms of internet access with only 22% of the population reporting using the internet in 2020, the second to lowest among peers, only above Uganda’s 6%. It is also below Sub- Saharan Africa’s average of 29.3% ( Figure 49) 44 .
41 See the following link . 42 See the following link . 43 See the following link . 44 See the following link.
Report Growth Diagnostics and Competitiveness Study of the Manufacturing Sector in Tanzania 47
Figure 49: Broadband and internet access
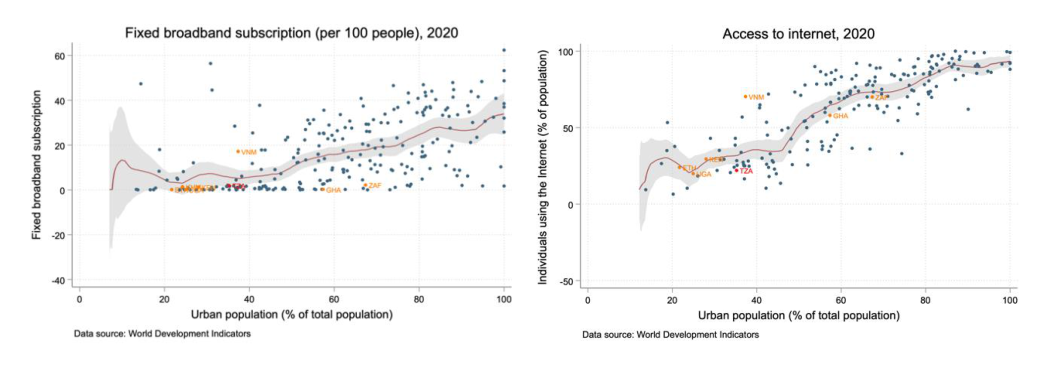
As access expands, there is an opportunity to enhance adoption in business. According to the World Bank’s digital dividends, Tanzania ranks second to lowest among peers in both overall adoption and in particular, adoption by businesses (Figure 50). This signals that there is still potential for businesses to benefit from the gains of digital adoption. Tanzania enjoys the cheapest price of broadband data (measured as US per gigabyte) in East Africa at an average price of USD 0.71 and ranking in the middle with regards to comparator countries – with only Cambodia, Vietnam, and Ghana recording lower prices 45 . According to the TCRA, this places Tanzania as the seventh cheapest in Africa and 50 th in the world.
Figure 50: Digital Adoption Index
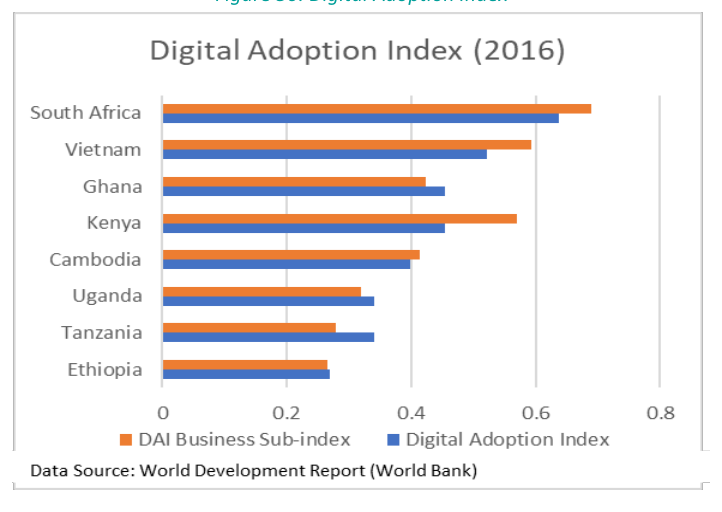
Overall, while there is room for Tanzania to fully leverage the advantages of improvements in telecommunications infrastructure, it does not seem to be a binding factor. The recent improvement in trajectory and push to expand 5G access and adoption, signals that telecommunications infrastructure is unlikely to be a binding constraint for the manufacturing sector at present given the available evidence.
45 See the following link .
Report Growth Diagnostics and Competitiveness Study of the Manufacturing Sector in Tanzania 48
2.2.3. Water
Tanzania is a water abundant country located in the Great Lakes region and has plenty of freshwater resources from river basins, lakes, and natural wetlands. This includes the lakes Victoria, Malawi, Tanganyika, and the Wami-Ruvu and Rufiji River basins. The Ministry of Water, in charge of implementing the National Water Policy (NAWAPO), manages to supply 226 billion cubic meters of water (about half from underground sources and half from surface water) 46 . The sector is regulated by the Energy and Water Utilities Regulation Authority (EWURA).
Tanzania has made significant progress in its efforts to expand access to water and sanitation. Access to basic water supply increased to 63% of the population in 2021 from 50% in 2015, however, the gap between urban and rural was high (with 79% and 37% access respectively). Now in its third phase, the Water Sector Development Programme has been Tanzania’s main strategy for water infrastructure development since 2006. It has received key support from international organizations including the World Bank which has provided $300 million to this new phase which aims to expand access to an additional 10 million Tanzanians 47 .
Water is perceived as an obstacle for firms, as measured by reports of water insufficiencies. More than a third of manufacturing firms report experiencing water insufficiencies and cite about three instances of insufficiencies a month (Figure 51). This is high compared to peers (only below Kenya, Ghana, and Ethiopia) and high for its GDP per and the Sub-Saharan Africa average of 22%. Yet despite being an obstacle, the share of water destined for industrial uses is extremely low. Agricultural activities take a large proportion of water usage at 89%, compared to a global average of 70%. Meanwhile, 10% is destined for domestic consumption and only 1% is used for industrial production, which is low compared to global standards 48 . The low intensity in water usage in industry therefore likely limits its relevance to the manufacturing sector.
Figure 51 : Tanzania’s water supply
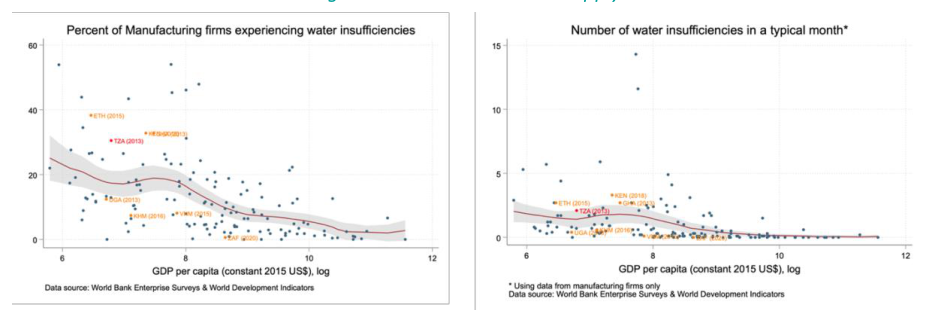
Water insufficiencies seem to be both related to water scarcity and inefficiencies in water management. Tanzania is water abundant, however, due to the rapid increases in population Tanzania’s per capita amount of renewable freshwater has fallen from 3 ,000 m 3 per person to 1,600 m 3 in the last 25 years, which is below the 1,700 m 3 indicator for water stress 49 . This has also been partially driven by droughts, which increased water strain and led the government to ration water in 2022. Moreover, there is evidence that there are some limitations in management, especially in agricultural activities that use water inefficiently.
46 See the following link . 47 See the following link . 48 See the following link . 49 See the following link .
Report Growth Diagnostics and Competitiveness Study of the Manufacturing Sector in Tanzania 49
While water has not been a constraint for the manufacturing sector so far given its low use, as the manufacturing sector grows, this could become more relevant. As Tanzania’s industry diversifies, water demand for industrial purposes is likely to increase, putting pressure on water sources. Further investments in water management would likely be needed as the industry expands 50 .
2.2.4. Electricity
The power sector in Tanzania is mostly owned and operated by the state-owned vertically integrated company Tanzania Electric Supply Company (TANESCO), which serves as the country’s principal electricity generator, transmitter, and distributor. While TANESCO operates the main grid and 18 isolated grids to provide mainland Tanzania with electricity, its services are complemented by independent power producers, who also generate their own capacity and the Zanzibar Electricity Corporation (ZECO) which serves the islands of Zanzibar and Pemba 51 . Despite that, the electricity sector is not very competitive, with several initiatives to unbundle TANESCO’s concentrated generation seeing little to no progress. The main regulatory bodies include the Ministry of Energy, which is responsible for the broad sector’s oversight and development, the Energy and Water Utilities Regulatory Authority (EWURA) which independently oversees the energy sector, and the Rural Energy Agency (REA), which promotes access to power in isolated areas.
Tanzania’s electricity generation increased more than two -fold over the last 20 years and has always been well diversified. While in 2000 local electricity generation stood at 2.5 TWh, it has since grown to more than 8 TWh (Figure 52). In 2021, the dominant source of energy for electricity production was hydropower, representing more than 35% of the total, followed by oil (30.8%), and natural gas (24.4%) (Figure 52). This composition changed significantly over time. Natural gas was not massively used for domestic power production up until 2017, with hydro dominating the mix up to 2010 and becoming the second most important source after that. While the historical dependency of the country on hydropower makes it vulnerable to climate shocks, Tanzania has engaged in diversifying its energy mix to include renewables and natural gas to ensure a reliable supply of power for the economy, which stood at 1,605.86 MW as of 2021 52 .
Figure 52: Electricity generation
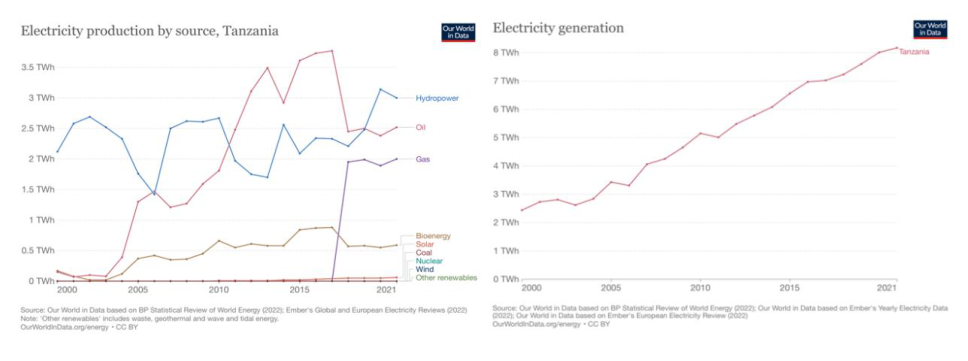
Report Growth Diagnostics and Competitiveness Study of the Manufacturing Sector in Tanzania 50
Total electricity consumption has also been growing, particularly at the household level, with energy demand projected to increase four-fold from 1,120 MW in 2019 to more than 4,000 MW in 2030 53 . In 2020, domestic electricity consumption stood at around 7 TWh, compared to less than 2 TWh in 1990. While at the beginning of the period residential consumption was comparable with that of industry, in 2020 the divergence between the two was a striking 80%, with households consuming electricity at a much faster pace (Figure 53). Considering the current trend, the International Energy Agency forecast shows that in the future, the difference between residential and industrial consumption might rise even further: by 2030, the gap is projected to widen to 4,000 GWh, or more than 200% difference (Figure 54).
Figure 53: Electricity consumption by market segment
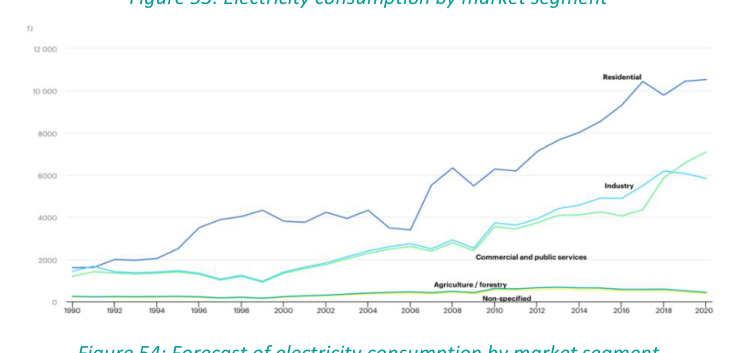
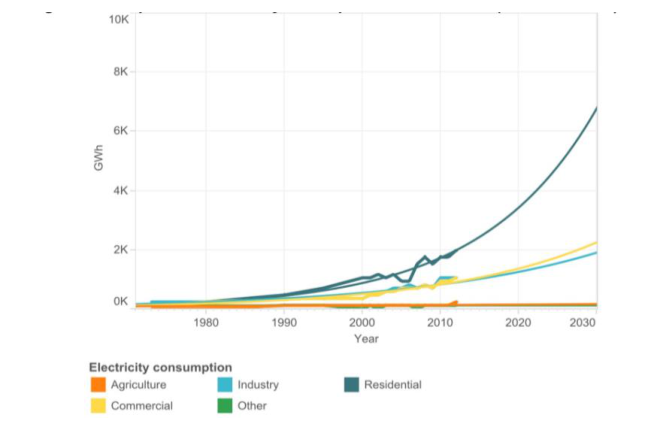
Source: International Energy Agency While average electricity consumption per capita in Tanzania is low when compared to peers, Sub-Saharan, and the world average, electricity demand is projected to grow substantially. Tanzania’s electric power consumption per capita is among the lowest in the peer group (Figure 55), standing at 108 kWh per year – compared to the 550 kWh average in Sub- Saharan Africa and the 2,500 kWh average in the world 54 . Even though electrification expanded rapidly over the last 20 years, just below 40% of the total population had access to electricity in 2020, the lowest level among peers (Figure 55). These low numbers seem to be driven largely by the access to electricity problems experienced in rural areas; only 22% of the rural population had access to electrical power in 2020, compared to more than 70% in urban areas (Figure 56).
53 Based on Low and Base Case projections made in Tanzania’s PSMP Update 2020, pp. 27 -28: ( link ) 54 See the following link .
Report Growth Diagnostics and Competitiveness Study of the Manufacturing Sector in Tanzania 51
Figure 55: Access to electricity
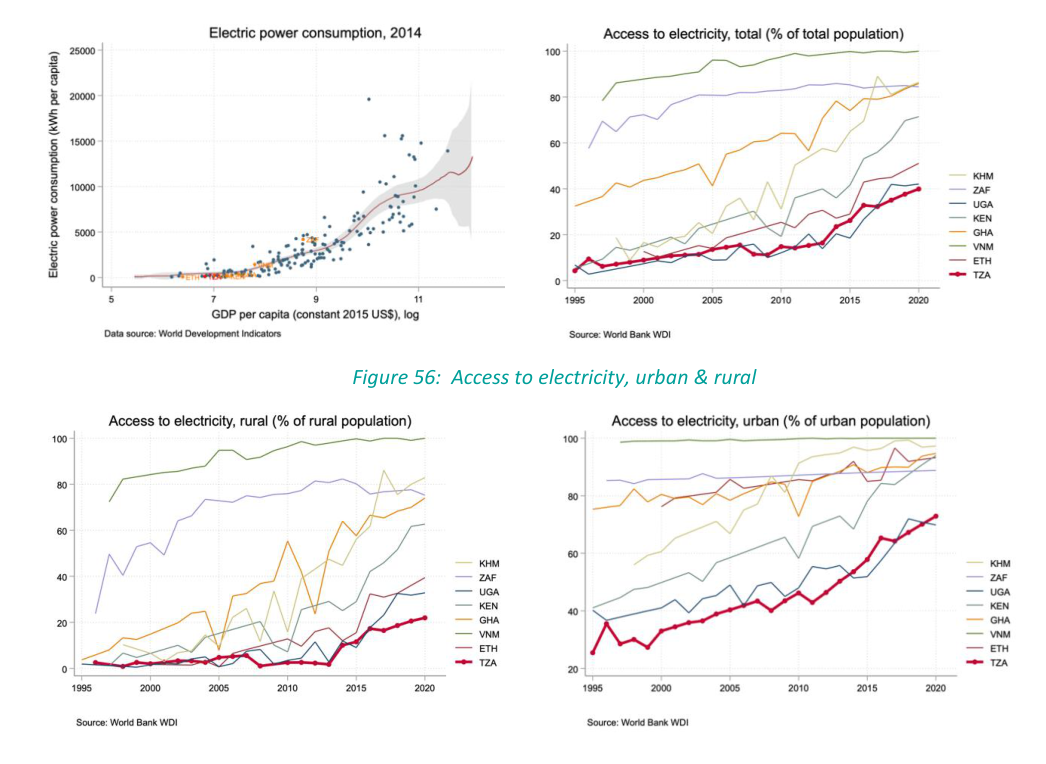
Despite large domestic energy resources and the fact that current domestic demand is comparable to supply, data up until 2019 shows that Tanzania relied on fuel-based energy, which required oil imports from Uganda, Zambia, and Kenya. Even though Tanzania is estimated to have 57 trillion cubic feet of gas reserves 55 – enough to cover the domestic energy needs and export abroad 56 – in 2022 Tanzania was still importing 115,000 thousand kWh of electricity from Uganda and 46,000 thousand kWh from Zambia 57 . Imports of electricity and oilbased electricity production are expensive, tend to be volatile and are sensitive to currency depreciation.
To meet the projected demand increase Tanzania is actively engaging in expanding its installed capacity for gross energy generation, which is projected to increase from below 8,000 GWh in 2019 to more than 28,000 GWh in 2030 58 . Several ambitious initiatives have been put forward over the recent years, including the TANESCO-owned Julius Nyerere Hydropower Project. With an installed capacity of 2,115 MW, this would be the largest hydropower station in the East African Community (EAC). If completed – the mega-dam faces significant criticism associated with potential negative environmental and socio-economic impacts 59 – the mega-dam alone would cover existing domestic demand and allow for the export of electricity to neighboring countries. Other projects include the 300 MW Mtwara Gas-Fired Power Plant, the 330 MW Somanga Fungu Gas-Fired Power Plant, and the 87 MW Kakono Hydropower Project 60 .
55 See the following link . 56 See the following link . 57 See the following link . 58 Based on Low and Base Case projections made in Tanzania’s PSMP Update 2020, pp. 27 -28: link 59 See the following link . 60 See the following link .
Report Growth Diagnostics and Competitiveness Study of the Manufacturing Sector in Tanzania 52
While electricity prices are low and even falling over time, they do not reflect the true cost of energy: prices are heavily subsidized by the government and are set below TANESCO’s longterm marginal costs, which doesn’t allow them to recuperate long -term investments and generate market returns. According to TANESCO’s income statement, since 2010 and more particularly in recent years, operating revenues are not growing fast enough to cover expenses and cost of sales, which includes electricity generation and transmission, the purchase of electricity, distribution expenses, and depreciation. For example, by 2013 operating revenue had grown by 642 billion TZS with respect to 2007, while the operating cost of sales increased by 1, 033 billion TZS over the same period. In 2010, TANESCO’s hidden costs amounted for around 90% of its revenues, with the biggest losses coming from subsidizing tariffs (Figure 57) 61 . Moreover, from 2011 to 2013, accumulated TANESCO’s losses almost doubled, going from 800 to 1,450 billion TZS 62 , with the total comprehensive loss for the year ending on June 30 th 2018 standing at 112 billion TZS (down from 256 billion in 2017) 63 .
Figure 57: TANESCO revenues & costs
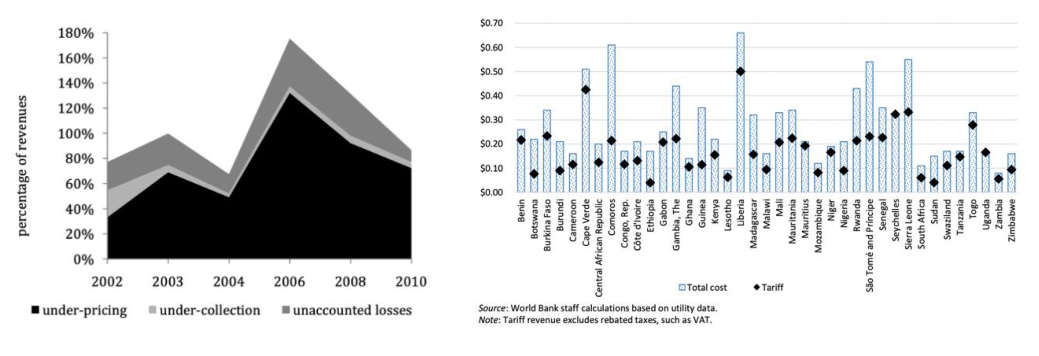
Source: Shkaratan M. , 2012. Tanzania’s Infrastructure: A Continental Perspective. World Bank Policy Research Working Paper 5962; Trimble et al., 2016. Financial Viability of Electricity Sectors in Sub-Saharan Africa. Policy Research Working Paper 7788.
Even though the overall quality of electricity supply has been increasing over the years ( Figure 58 ) 64 , Tanzania still underperforms its peer group in many electricity-related metrics. The country has a disproportionately high share of firms experiencing electrical outages and is the worst-off peer in terms of the number of electrical outages in a typical month (lasting on average nine days per month). In 2013, according to the World Bank Enterprise Survey, more than 85% of firms experienced electrical outages, well above what one would expect for Tanzania’s level of income. While power transmission and distribution losses have gone down from their peak in 2010 – putting Tanzania in the middle of the peer group for the first time in the observed period – firms still complain about the unstable power supply, and voltage fluctuations, making the electricity problem in the country multifaceted (Figure 58).
61 See the following link . 62 See the following link . 63 TANESCO Annual Report 2017/18, p. 58: link . 64 All data used is the latest data available for the respective indicators. The years are outlined in each figure separately.
Report Growth Diagnostics and Competitiveness Study of the Manufacturing Sector in Tanzania 53
Figure 58: Transmission and distribution losses and electrical outages
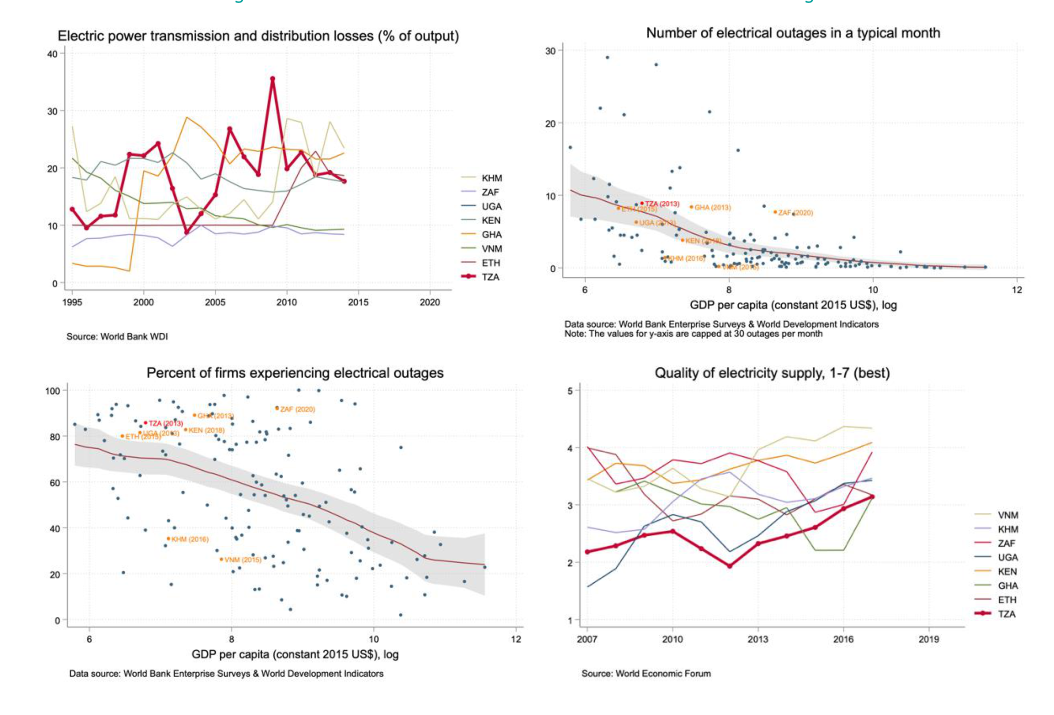
For Tanzanian firms, average losses due to outages are among the highest in the peer group and internationally. An average firm in Tanzania loses more than 15% of its annual sales because of power disruptions, which puts the country among the worst for its income level and within its peer group (Figure 59). Indeed, qualitative interviews with firms in Tanzania suggest that they even make their business location decisions within the country based on electricity availability and quality, which varies significantly by region. Adil Khan et. al (2018) illustrate how much residential electricity access varies by geography in Tanzania, from 75.2% in Dar es Salaam to just below 40% in Arusha and 24.3% in Morogoro (Figure 59) 65 .
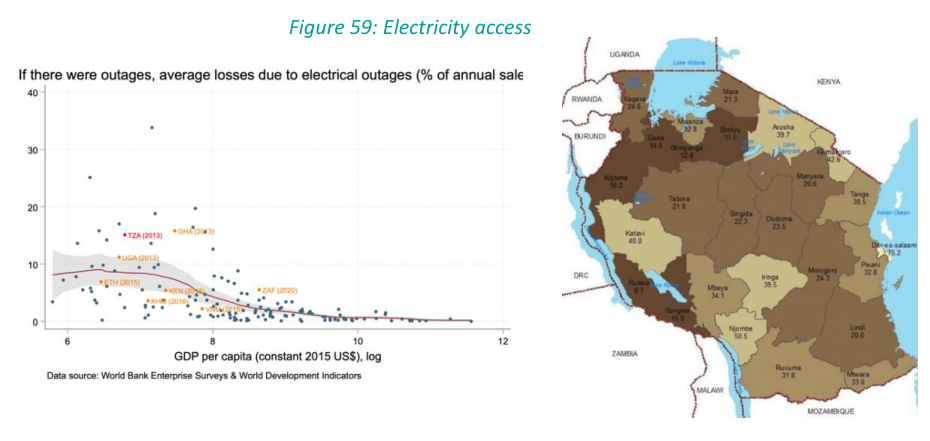
65 Adil Khan et. al (2018). A Novel Off-Grid Optimal Hybrid Energy System for Rural Electrification of Tanzania Using a Closed Loop Cooled Solar System.
Report Growth Diagnostics and Competitiveness Study of the Manufacturing Sector in Tanzania 54
Signals resulting from a thorough deployment of the principles of differential diagnosis suggest that access to power has been and remains one of the most significant binding constraints in Tanzania. Prices per kWh are among the lowest in the peer group (Figure 60), but as they are regulated and subsidized, they cannot be interpreted as signals of relative scarcity. The most recent data shows that the average electricity prices per kWh in 2022 were even lower than in 2019, with residential prices standing at 0.098 USD and industrial prices – at 0.101 USD 66 . However, these prices are not informative as diagnostic signals in Tanzania’s context because they do not reflect cost, quality, or excess demand.
Figure 60: Price of electricity
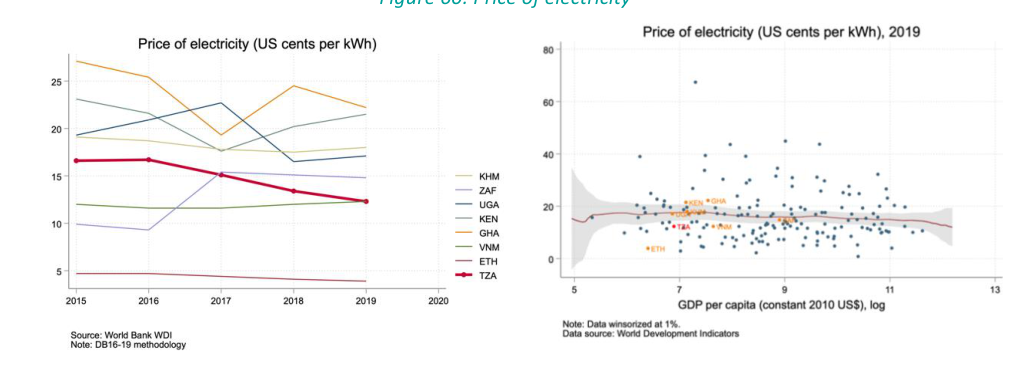
When prices per kWh are not informative, firms’ complaints in surveys can be used as a shadow price signal. The country has a disproportionately high share of firms reporting electricity as their most important constraint. Though improving from 2006 to 2013, this complaint is still very salient (Figure 61). Tanzania is the second worst-off peer in terms of the number of firms choosing electricity as the main obstacle to businesses. As a matter of fact, the country comes second only to South Africa, which is well-known for its electricity generation and transmission problems and is currently undergoing an energy crisis, with the government looking to impose a “state of disaster” to tackle it 67 .
Figure 61: Electricity as one of the most important constraints (Enterprise Survey)
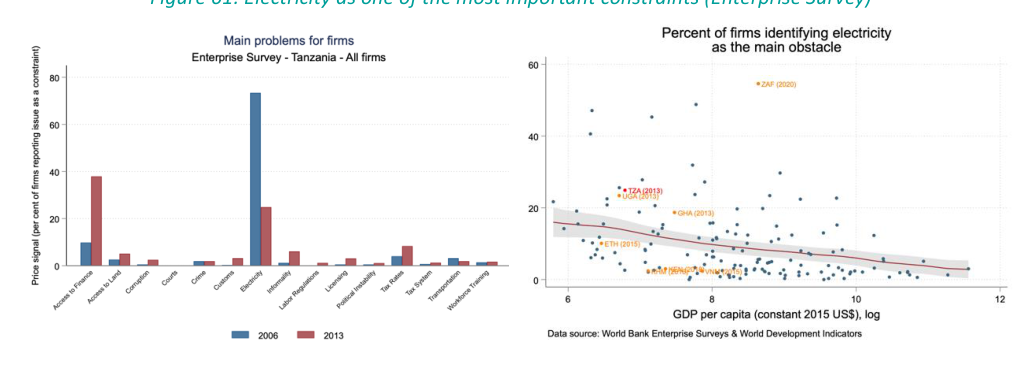
66 Electricity rates per kWh are calculated using the average annual household electricity consumption and, for businesses, the estimate of 1,000,000 kWh annual consumption. Source: link . 67 See the following link .
Report Growth Diagnostics and Competitiveness Study of the Manufacturing Sector in Tanzania 55
Over the decades, access to electricity has been a persistent issue for larger firms in Tanzania. In 2006 when the first wave of the Enterprise Survey was conducted, electricity was clearly and by a large margin the biggest problem facing businesses in Tanzania. From 2006 to 2013 (the most recent year of the available), electricity had become less of an issue for firms of all sizes, as other constraints began to rise (Figure 62). Yet in both waves, the issue with electricity access remained the biggest problem for large firms, consistent with the fact that bigger firms are more energy-intensive by design 68 . Indeed, all firms with more than 100 employees interviewed during the field trip to Tanzania complained about electricity as one of the most important constraints they face.
Figure 62: Most important business obstacle by firm size (Enterprise Survey)
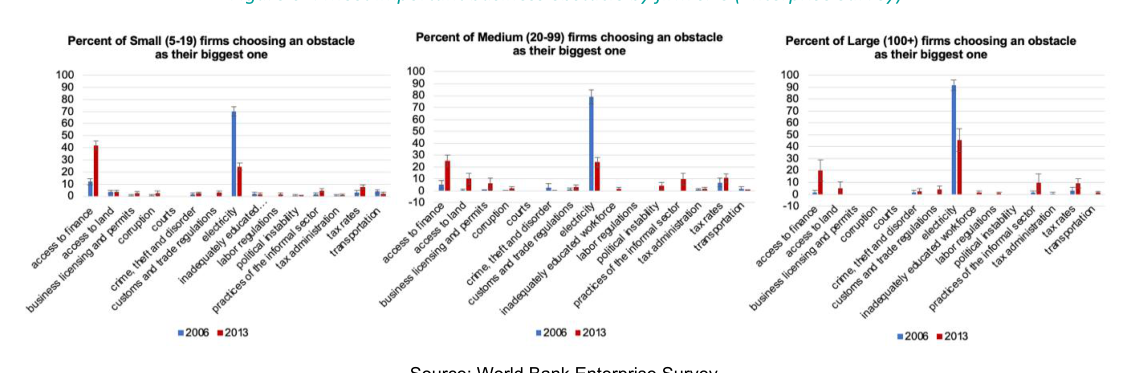
Source: World Bank Enterprise Survey.
The same is true if zeroing in on the manufacturing sector: Tanzania’s manufacturing sector has one of the highest rates of electricity problems and one of the highest “costs” of outages. While more than 30% of manufacturing firms report electricity as the main obstacle, more than 80% experience outages in 2013 (Figure 63, Figure 64). As industry and manufacturing tend to be far more energy-intensive than agriculture or services, they are more vulnerable to power cuts. Evidence collected on the ground suggests that these issues persisted in 2022, with the firms in the Textiles, Metals, and Food processing sub-sectors indicating the power outages continue and countermeasures (for example, owning a gasoline generator) are expensive. Firms in the manufacturing sector tend to be more affected by outages in terms of costs and lose more in monetary value, especially in the poorer counties – as suggested by a higher concentration of points in the upper-left quadrangle of Figure 64. However, in Tanzania, the losses seem comparable across the firms in the economy.
Figure 63: Quality of electricity supply and complaints on electricity in the manufacturing sector
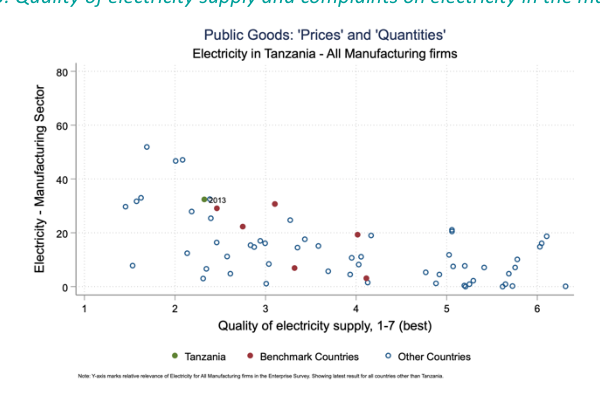
Report Growth Diagnostics and Competitiveness Study of the Manufacturing Sector in Tanzania 56
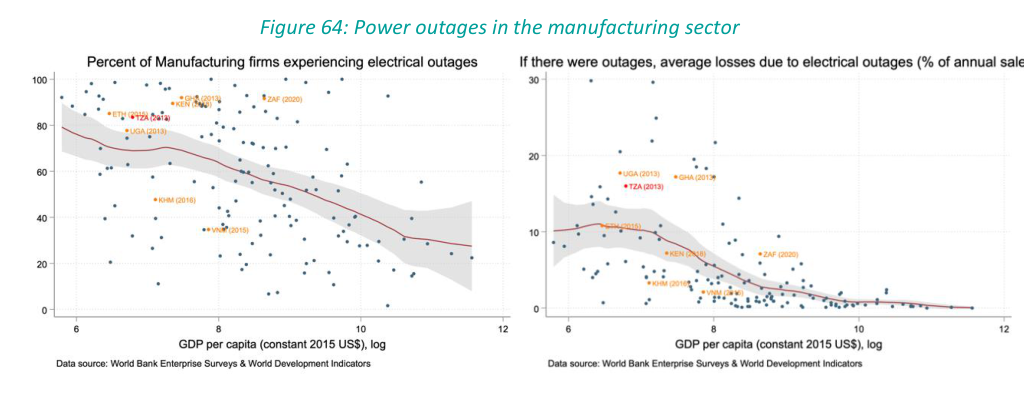
While firms complain about electricity, they do not seem to be trying to overcome the constraint by relying on their own generators. Just below 45% of the firms in the economy own or share a generator as of 2013, which is below the international average, and below peers, particularly those that experience similar electricity-related problems like South Africa or Uganda ( Figure 65 ). The same is true just for the manufacturing sector, where Tanzania stands as a clear outlier with below 30% of the firms using a generator, half the share of South Africa. One potential explanation for firms complaining about electricity but not owning generators is the massive gap between the heavily subsidized electricity prices and the costs of independent power generation – heavily influenced by fuel market prices of gasoline. That hypothesis is consistent with the reports coming from firms on the ground, which stated that generators are a significant incremental expense and cannot be used to run the whole plant but rather to maintain a share of their production lines functioning during power outages.
Figure 65: Generator ownership
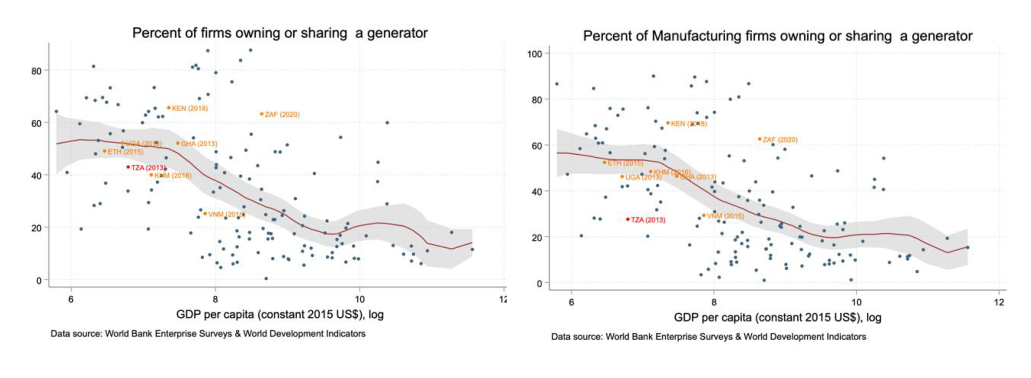
This report relies on a consistent definition of high, moderate, and low energy-intensive industries, based on UNIDO’s compilation of energy statistics for economic analysis to test for electricity as a binding constraint. UNIDO’s definition is based on ISIC Rev. 3.1 industry classification and allows for tracing sectoral performance over time and comparing statistics internationally. According to this classification, low energy-intensive industries include, among others, Tobacco (ISIC 16) and Furniture (ISIC 36), moderate energy-intensive industries – Food and Beverages (ISIC 15), Wood products (ISIC20), and high energy-intensive industries – Textiles (ISIC 17), Non-metallic mineral products (ISIC26), Base metals (ISIC27), and Chemical Report Growth Diagnostics and Competitiveness Study of the Manufacturing Sector in Tanzania 57
products (ISIC 24) 69 . Relying on the UNIDO dataset allows to overcome the large variations in average electricity usage within the same industry observed in the ASIP data (Figure 66).
The contrast between the size and growth of existing industries and their different energy intensities can be used to test for the factor as a potential binding constraint. If firms in sectors intensive in the use of electricity tend to be less prevalent in exports, value-added, or GDP, it might mean that electricity is a constraining factor for their growth and expansion. In other words, if electricity were the most binding constraint, we would expect to see the less electricityintensive industries thrive and the more electricity-intensive industries struggle.
Figure 66: Average electricity consumption by subsector
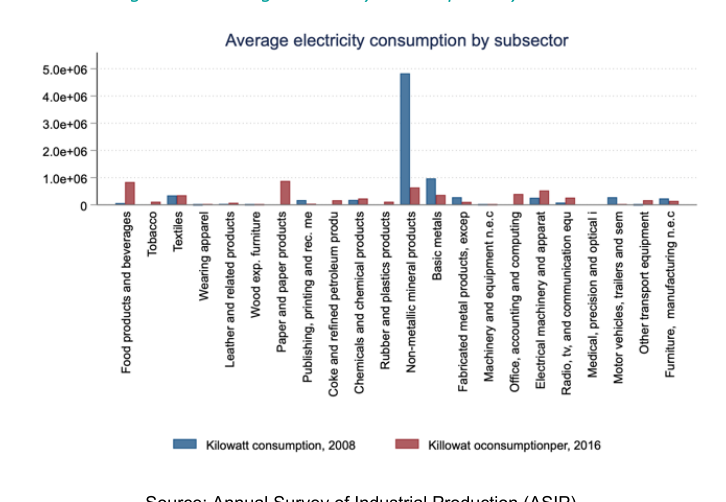
Source: Annual Survey of Industrial Production (ASIP).
Tanzania’s domestic production is dominated by industries of moderate energy – intensiveness, whose value added seems to have grown the most over the last 20 years. From 2003 to 2019, the total value added from the moderate energy-intensive industries increased more than four-fold. At the same time, however, as a share of total value added, it stayed approximately the same, fluctuating around 75-80% of the total each year. The same is true for the share of high energy-intensive industries in the total value added, which over the years spanned from 9% to 18% (Figure 67). When decomposing the growth by ISIC sub-sector, it’s been driven by just a few of them: Food products and beverages (ISIC 15) for the moderate energyintensive cluster, and Non-metallic mineral products (ISIC26) and Chemical products (ISIC 24) – for the high energy-intensive 70 .
69 The UNIDO’s compilation of Energy statistics for economic analysis (2010) indicates that the high intensity of energy consumption subsectors is: 17 manufacturing, 21 paper and paper products, 23 coke and refined petroleum products, 24 chemical products, 26 non-metallic mineral products, and 27 manufacture of basic metals. The moderate energy intensive subsectors are: 15 food products and beverages, 18 wearing apparel; dressing and dyeing, 19 manufacture of leather products, 20 wood and wood products, 22 printing and publishing, 14 rubber and plastic products, 28 fabricated metal products. The low energy-intensive products are 16 tobacco products, 29 machinery and equipment n.e.c, 30 office, accounting, and computing machinery, 31 electrical machinery and apparatus n.e.c., 32 radio, TV and communication equipment, 33 medical, prevision and optical instruments, 34 motor vehicles, trailers, and semi-trailers, 35 other transport equipment, 36 furniture and other manufacturing n.e.c, and 37 recycling. 70 See Appendix 11.
Report Growth Diagnostics and Competitiveness Study of the Manufacturing Sector in Tanzania 58
Figure 67: Manufacturing in Tanzania: value-added by energy intensity
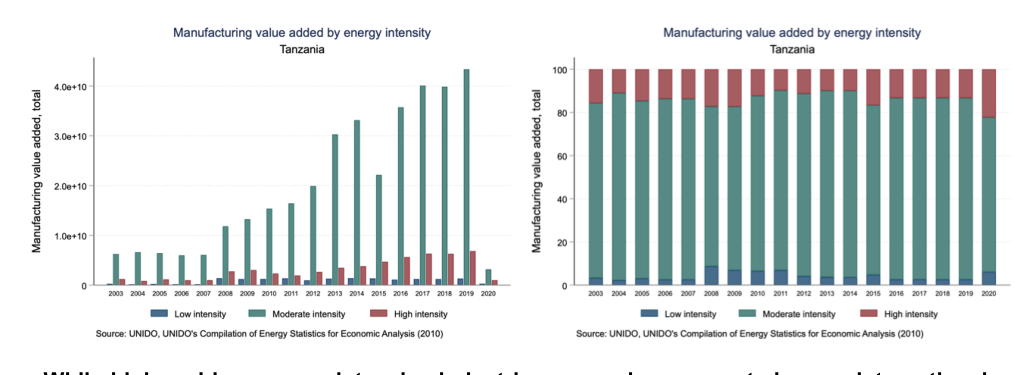
While high and low-energy-intensive industries are underrepresented on an international scale ( Figure 68 ) the dominance of moderate energyintensive sectors in Tanzania’s domestic manufacturing sector is partially explained by trade policy . Figure 69 shows that the large manufacturing industries of moderate energy intensity are protected by higher tariffs, creating a wedge that allows Tanzanian firms to thrive in the domestic market with the electricity handicap. Thus, Tanzanian consumers are forced to pay higher prices in these sectors than they would for unrestricted imports from electricity-efficient countries, but those higher prices result in Tanzanian firms specializing in manufacturing activities that might otherwise disappear.
Figure 68: Manufacturing: value-added by energy intensity versus peers
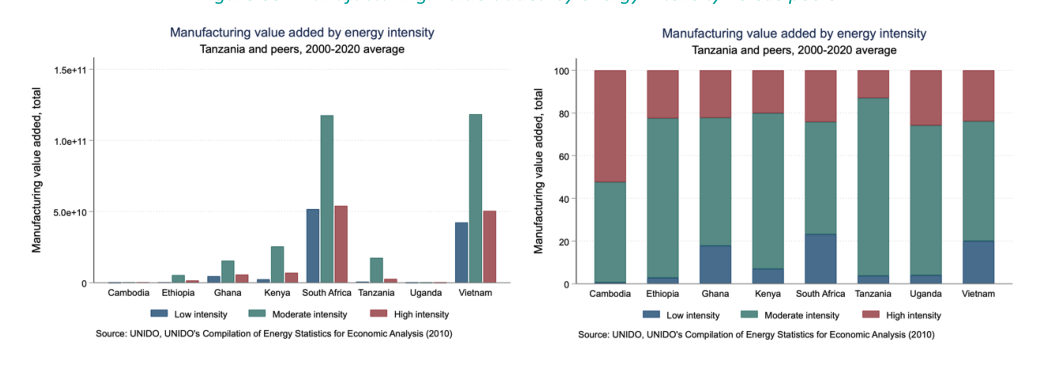
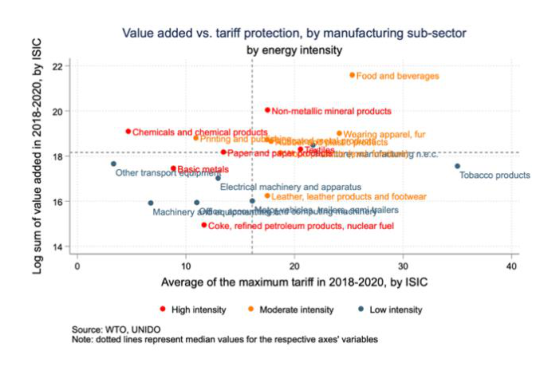
Report Growth Diagnostics and Competitiveness Study of the Manufacturing Sector in Tanzania 59
As the export basket is dominated by minerals and stones, its energy intensity is quite high, in contrast to that of value added. While up until 2008, moderateand high-intensity exports grew at a comparable pace, the picture changed dramatically around 2012. From then onwards, Tanzania started to actively expand its stone exports (gold and other precious stones), along with minerals (precious metals ores), and metals (mostly, unrefined copper) (Figure 70). Even though direct extraction of these products is not considered in manufacturing (as it is a part of the Mining and Quarrying category, which corresponds to ISIC Rev. 3.1 Division 10-14), it has large spillovers to manufacturing in the form of basic processing of mining-related exports. Indeed, Appendix 12 shows that the manufacturing net export growth on the high energy-intensive side is driven by a single sub-sector – Basic metals (ISIC 27). When decomposing further within ISIC 27, the highest-growing sub-categories include Manufacture of basic precious and non-ferrous metals and Manufacture of basic iron and steel.
When e xcluding Basic metals, the export’s energy intensity become s more aligned with domestic intensity. Given that net growth in manufacturing has been driven by mining-related, low-complexity, and high electricity-intensity products, it is important to explore the dynamics of the sector excluding those. Indeed, the picture changes dramatically after excluding ISIC-27 products, with moderate energy-intensive industries dominating the decomposition (Figure 71). At the same time, however, high energy-intensity exports seem to be growing quite substantially from below 10% of the total net exports in 2000 to around 35% in 2019.
Figure 70: Manufacturing exports by energy intensity
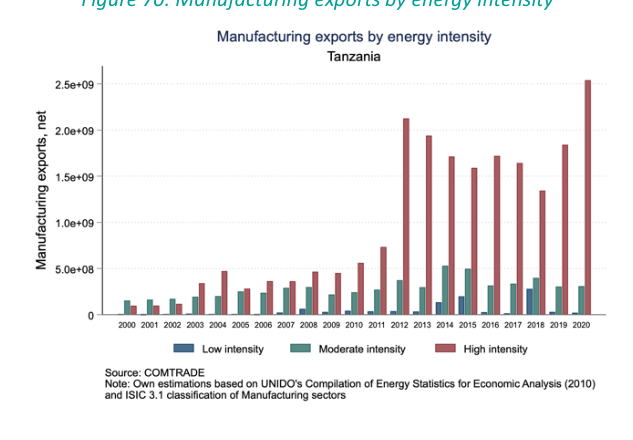
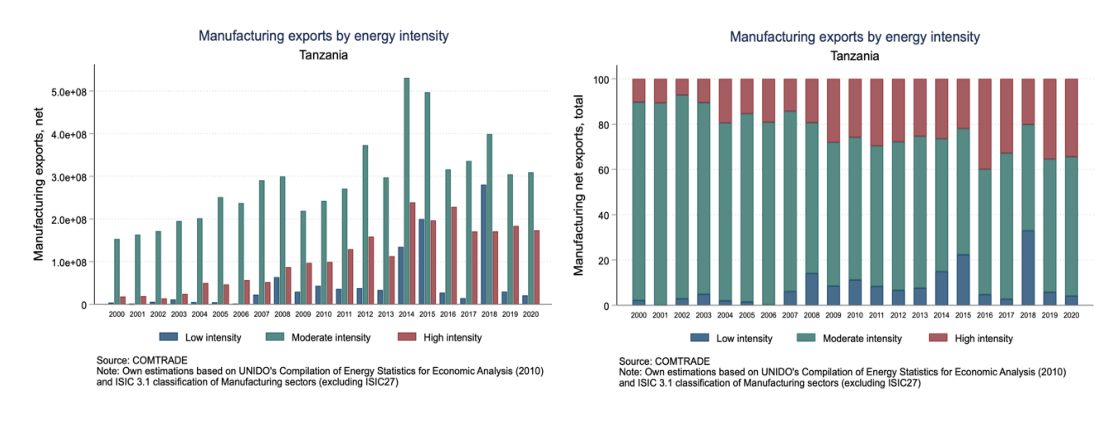
Report Growth Diagnostics and Competitiveness Study of the Manufacturing Sector in Tanzania 60
Despite their lower proportion in terms of value-added, the share of energy-intensive manufacturing in Tanzania’s export s is one of the highest among peers ( Figure 72 ). This signal is difficult to interpret. Even after removing basic metals from consideration, the share of high energyintensive industries in Tanzania’s exports is top among peers, second on ly to South Africa. This is puzzling, since electricity is known to be one of the most binding constraints in South Africa . Tanzania’s non -mineral related manufacturing exports only represent 1.6% of GDP in 2020 (with net exports standing at below 1%), which compared to domestic manufacturing value added (9% of GDP) is relatively insignificant. Finally, anecdotal evidence gathered during field interviews indicates that some energy-intensive export industries are also shaped by trade policy, in this case by prohibiting exporting raw forms of natural resources and agricultural goods to force domestic processing.
Figure 72: Net manufacturing exports by energy intensity vs. peers
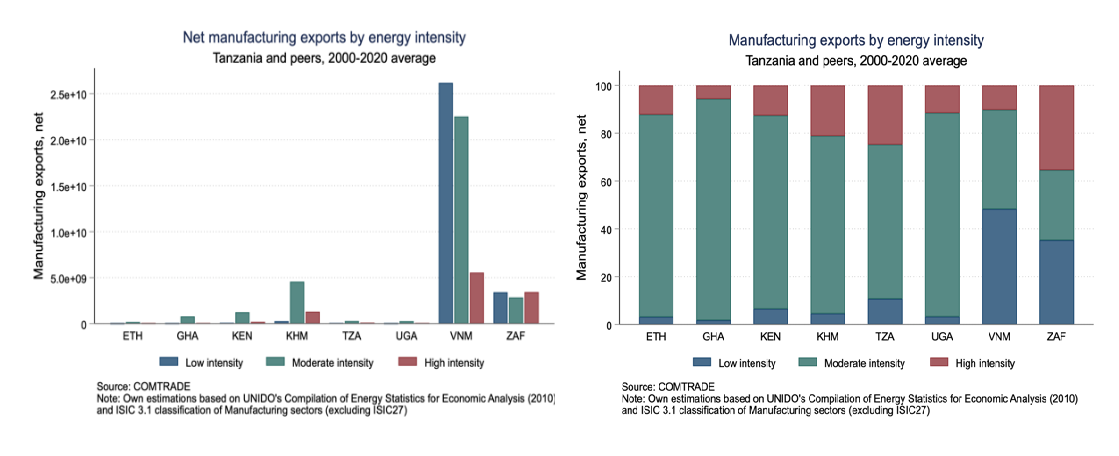
Evidence based on firm-level data available for 2013-2016 also suggests that electricity poses a binding constraint in the manufacturing sector: the total value-added per subsector and the growth in value added are negatively correlated with energy intensity. In this specification of the test, energy intensity is defined as the average electricity consumed (in kWh) per value added generated, aggregated on a sub-sector level (ISIC Rev. 3.1), which is a more detailed measure than the three UNIDO categories of intensity. Despite data being limited to only four years of observations, it is sufficient to see a negative correlation present for both, average value added and its growth, and energy intensity. In other words, we see that less electricityintensive industries tend to generate higher value added and at a higher pace, than more electricity-intensive ones (Figure 73), which provides supportive evidence of electricity potentially being a binding constraint for the manufacturing sector.
Report Growth Diagnostics and Competitiveness Study of the Manufacturing Sector in Tanzania 61
Figure 73: Electricity consumption and value added
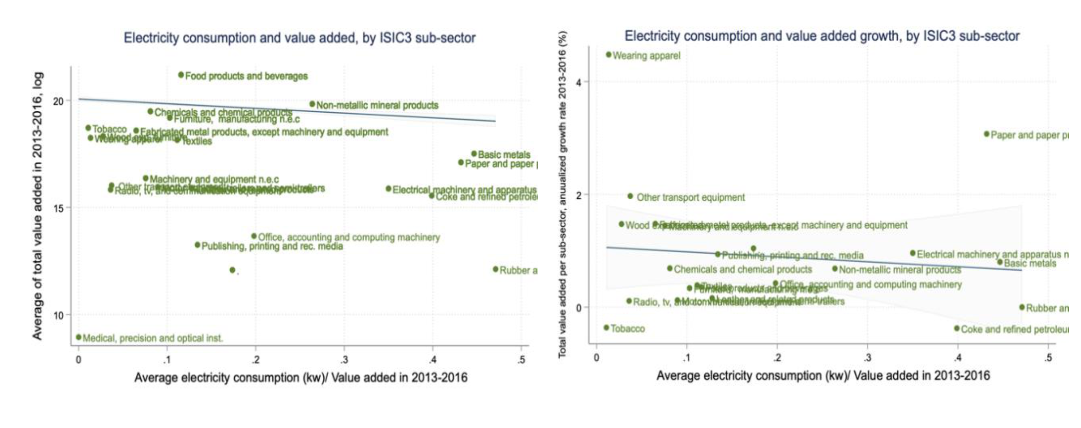
Source: Annual Survey of Industrial Production (ASIP).
The analysis of the “missing” industries implies that products that are “nearby” in terms of skills seem to be moderate in energy use, not as much low or high . The product’s density (from 0 to 1) aims at capturing the extent of a location’s existing capabilities to make the product as measured by how closely related a product is to its current basket of exports. 71 Sorting by the products that Tanzania does not currently export (RCA <1) and ranking them by density and PCI shows that “nearby” products of a higher density tend to be mostly moderate in energy use and have a low PCI. Thus, it does not seem to be the case that Tanzania is currently constrained in its economic diversification by energy. However, the products that seem more likely to drive diversification are less complex (PCI) than those that are “farther” and more energy intensive (Figure 74).
Figure 74: Energy intensity, density and complexity at the product level
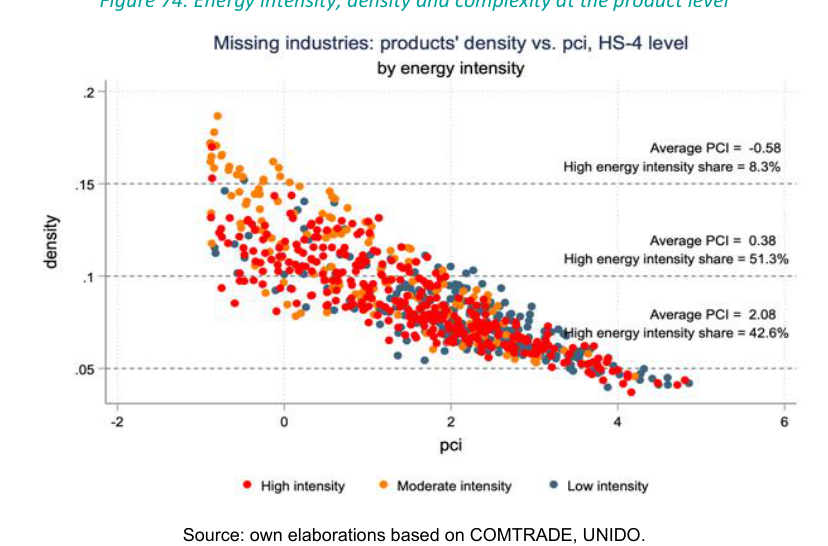
Source: own elaborations based on COMTRADE, UNIDO.
71 Density equals 1 minus distance. For more details: https://atlas.cid.harvard.edu/glossary Report Growth Diagnostics and Competitiveness Study of the Manufacturing Sector in Tanzania 62
Electricity appears to have been a key binding constraint over the past two decades – its full impact blunted by trade policy – but some improvements in the supply have helped in releasing the constraint. The pipeline of new power projects is substantial and should further relieve this constraint, yet demand will also continue to climb significantly and the impact of prices on TANESCO’s financial position could affect their ability to deliver on plans. The results suggest that further relaxing electricity as a constraint would likely translate into higher GDP growth and the value added of the manufacturing sector, as was the case in the last decades (Figure 75). And the inverse is true: failing to deliver on new generation projects to keep up with increasing demand by manufacturers as well as consumers could severely hamper future growth: South Africa represents a clear cautionary tale.
Figure 75: Electricity consumption and GDP growth
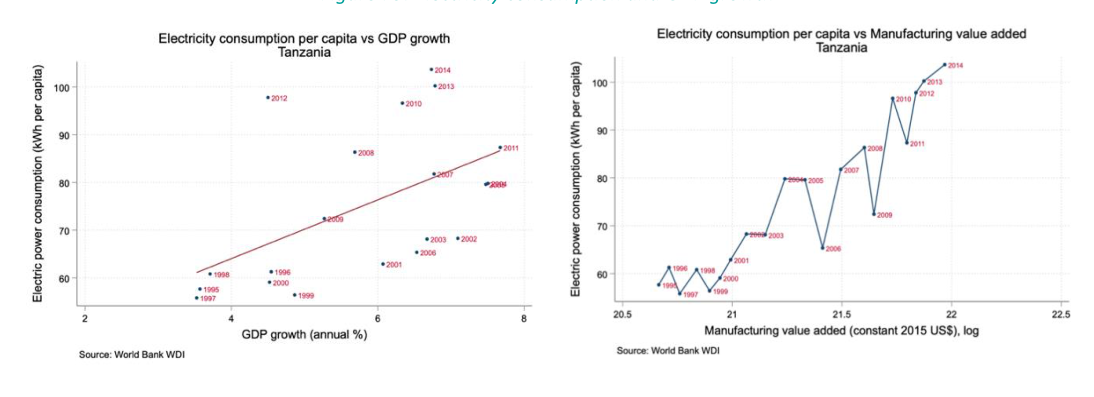
2.3. Low Social Returns – Human Capital
Human capital at the individual level is defined as the acquisition of knowledge and skills through education, training, or work experience. This knowledge allows workers to increase the marginal productivity of their efforts. Given this definition, to assess human capital as a binding constraint to growth, we need to identify if the skill spectrum is sufficient for companies to compete in productive economic activities can adopt new technologies in their production 72 . Human capital would reduce social returns to investment and become binding for the manufacturing sector if the stock of skills in the country is inadequate, rendering firms unable to exploit opportunities.
Despite important educational improvements in the country, enrollment rates for secondary and tertiary education are very low compared to peers and countries in the region. There have been important educational advances in the country. Education reforms during the late 1990s resulted in an increase in enrollment rates at all levels of education (USAID, 2013). Primary education enrollment rates improved from 70% at the end of the 90s to almost 100% in 2021. Nevertheless, enrollment rates for secondary and tertiary schools in Tanzania are still low. Despite improving secondary enrollment rates from 5.7% in 1996 to 31% in 2020, the country is still well below the peer and regional average (Figure 76). Tertiary enrollment rates are also lower than peers and the sub-Saharan region, reaching 7.8% in 2020, less than half the peers’ averag e and 40% below Sub-Saharan countries. As a result, the working age population of the country is composed mainly of individuals with low levels of education, and the proportion of tertiary-educated Tanzania is very low, reaching approximately 2% of the working age population in 2021, below the peer average (4.6%) 73 .
Report Growth Diagnostics and Competitiveness Study of the Manufacturing Sector in Tanzania 63
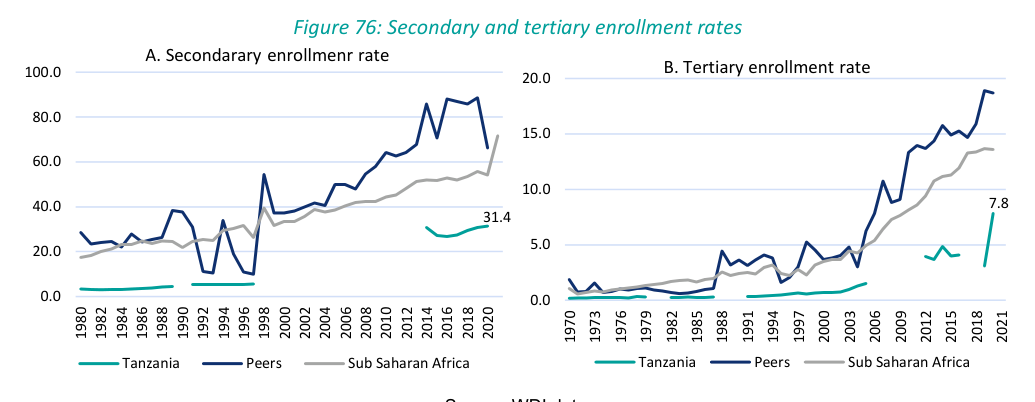
Source: WDI data.
In terms of overall educational attainment Tanzania ranks similar to peers and at the expected level given its income. When comparing Tanzania with other countries in the world we observe the expected educational attainment – measured as years of schooling of the working age population (15-64 years old) – for its level of income (Figure 77). On average, in 2021 the working-age population had 7.1 years of schooling, over the regional average. The country has almost doubled the years of schooling in the last three decades, going from 4.2 in 1990 years to 7.1 in 2021. Although higher educational enrollment rates are relatively low, that represents a relatively small portion of the overall population.
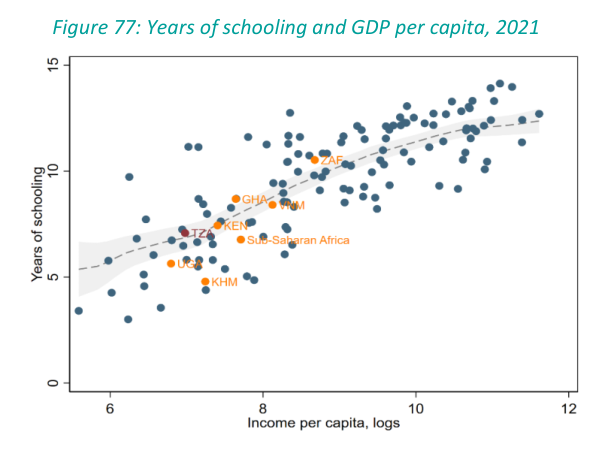
Sources: WDI data.
Educational attainment in Tanzania is improving when measured both in terms of access and quantity of education, but there are significant challenges in terms of quality . The quality of education – measured as learning-adjusted years of schooling (LAYS) – is lower than other countries with similar income per capita (Figure 78). Compared to peers, Tanzania is among the lowest in terms of LAYS. The Ministry of Education, Science and Technology accounted for the lack of adequacy in learning outcomes, indicating that the country is facing learning outcome challenges related to low levels of pass rates – particularly in secondary examinations – lack of qualified teachers, and curriculum coordination problems that result in poor skill development (MoEST, 2018). Moreover, the country also shows high rates of dropout, low competition rates at secondary levels partly due to shortages of teachers and schools, and low levels of advancement to higher education (World Bank, 2019).
Report Growth Diagnostics and Competitiveness Study of the Manufacturing Sector in Tanzania 64
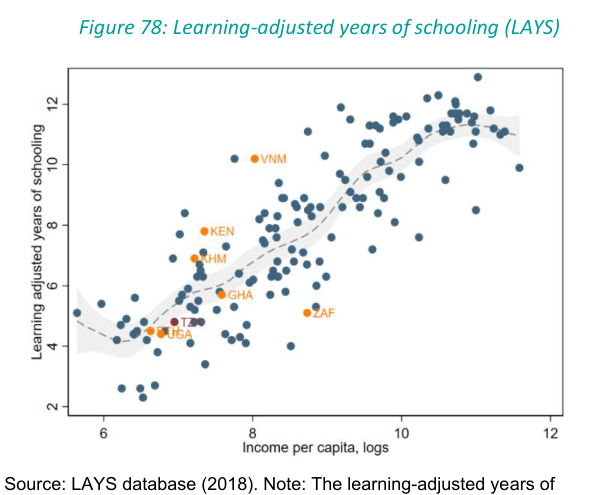
Source: LAYS database (2018). Note: The learning-adjusted years of schooling is a measure that combines quantity and quality of education.
To assess if human capital is a binding constraint to the manufacturing sector, we need to evaluate whether the supply is sufficient relative to demand from the private sector. Low levels of educational attainment aren’t themselves a signal as to whether human capital is a binding constraint. If the supply of skilled labor is constraining investment, firms should be bidding up a premium for it. We should then observe high returns to skills and education, relatively low unemployment of skilled workers, and firms indicating problems in finding an adequate workforce.
Estimates documented in the literature suggest that returns to schooling in Tanzania were amongst the highest in the peer group in past decades. Considering the estimations for all the countries conducted by Psacharopulos & Padrinos (2018) on average an extra year of education increased wages by 11.1% in Tanzania. The returns schooling in Tanzania were the fourth highest in the peer group (Figure 79, Panel A). Moreover, compared with regional and income classification averages presented by the authors, it was slightly above the overall rate for the Sub-Sahara region (10.5%) and low-income countries average (9.3%) 74 . Tanzania had the third highest returns to secondary education (11%) and the second highest for tertiary education (15%) (Figure 79, Panel B). It is important to note, however, that these results for Tanzania were using data from 2006.
Report Growth Diagnostics and Competitiveness Study of the Manufacturing Sector in Tanzania 65
Figure 79: Returns to schooling, Tanzania and peers
A. Returns by years of education
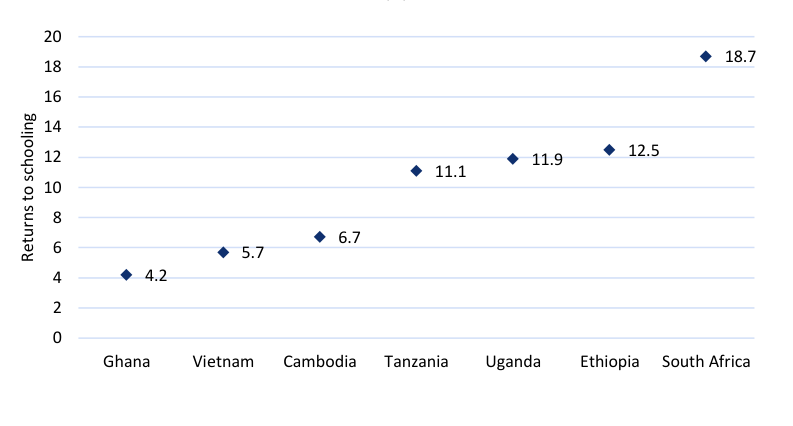
B. Returns to educational attainment
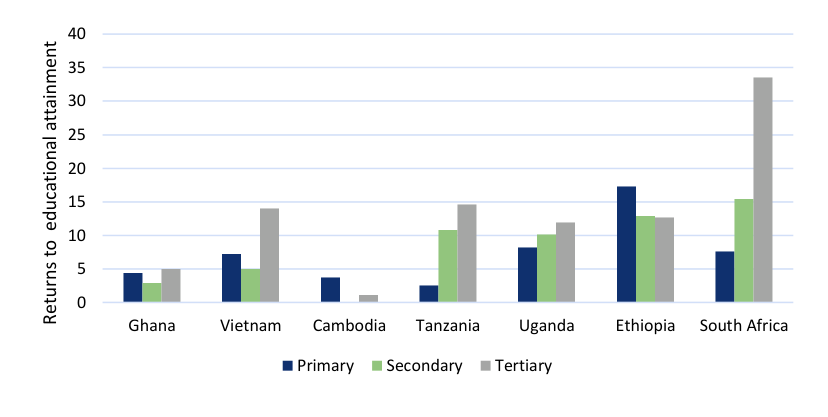
Source: Psacharopulos & Padrinos (2018). Note: The data used for the estimations were from 2007 for Tanzania, Cambodia, and Ghana, from 2008 for Uganda and South Africa, from 2011 for Ethiopia and from 2014 for Vietnam.
Our own estimations of the returns to schooling with more recent data show a decline in returns during recent years, and particularly low returns in the manufacturing sector. Based on the latest Integrated Labor Force Survey conducted in Tanzania (2020-2021), the average increase in income per year of schooling went from 11% in 2007 to 10% in 2021 (controlling just for experience) 75 . When adding sociodemographic controls to the estimation, the return to schooling decreased to 8% (Table 2). Within the manufacturing sector, the returns to education are lower (6%) compared to non-manufacturing sectors (8%). Aside from these, it is noteworthy the size of gender gaps, running from 46% lower wages for women (with respect to comparable men), 61% within the manufacturing sector.
Report Growth Diagnostics and Competitiveness Study of the Manufacturing Sector in Tanzania 66
Table 2: Mincer regression coefficients
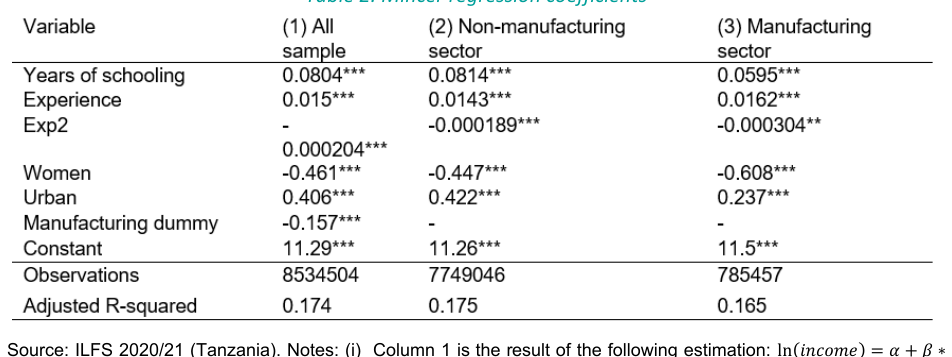
While the unemployment rate for those with primary education and those with vocational training has fallen over the past decade, it remains high for those with secondary education, and has risen rapidly for those with tertiary education. Though Tanzania’s tertiary enrollment rates are low, their growth in recent years has been accompanied by a near doubling of the unemployment rate for that group (Figure 80), which suggests either a lack of demand for those skills or potentially a quality or mismatch problem. Unemployment for those with secondary education has been flat at 14%. Vocational training is the only category above primary education where we observe increased demand for those skills and corresponding reduction in the unemployment rate. The fact that vocational training is undersupplied may be related to the misallocation of funds coming from the Skills Development Levy (SDL). Only one-third of the funds goes directly to the Vocational Education Training (VET) fund and the other two-thirds are destined to other funds, including higher education funds (SOAS, 2018).
Despite increasing unemployment, the wage premium for tertiary education is high. In 2021 an individual in the manufacturing sector with secondary education earned 21% more than those with primary or less education, controlling by sociodemographic variables (Figure 81). Workers with tertiary education receive 143% more income than those that completed primary school. Disaggregating by region, returns to tertiary education are particularly high in Dar es Salaam (153%).
Individuals with VET education also receive a wage premium of 77% (Figure 81). Vocational training is the one category with a higher wage premium in manufacturing compared to the rest of the economy, not only in Dar es Salaam but country wide.
Report Growth Diagnostics and Competitiveness Study of the Manufacturing Sector in Tanzania 67
Figure 80: Unemployment rate and labor participation by educational attainment, 2014 and 2020/2
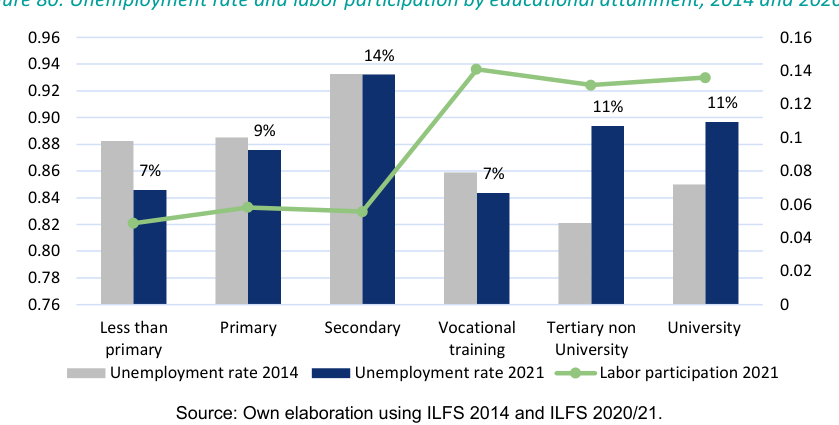
Source: Own elaboration using ILFS 2014 and ILFS 2020/21.
Figure 81: Educational premia manufacturing sector Tanzania, by region
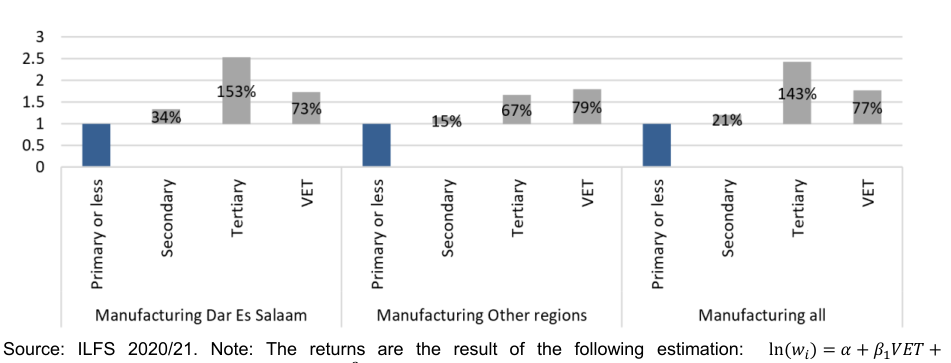
The proportion of firms indicating that an inadequately educated workforce is the main obstacle is low compared to peers and other countries in the world. Firm’s perceptions of the competence of the workforce speaks to the scarcity or excess of skills. The last version of the WBES included a question about the biggest barrier firms face. The ratio of manufacturing firms that indicates an inadequately educated labor force as the main obstacle is very low (0.3%), compared to peers and countries with similar income (Figure 82). In contrast, more than 40% of firms indicated that finance was the major constraint, followed by electricity 76 . A more recent analysis can be done using the Annual Survey of Industrial Production (ASIP), conducted annually from 2008 to 2016. According to ASIP, by 2016 approximately 18% of the firms indicated that their most important challenge was shortage of qualified labor – among the factors with the lowest mentions. Major challenges faced by the establishments were the high cost of production (74%) and shortages of raw materials (46%), amongst others 77 .
Report Growth Diagnostics and Competitiveness Study of the Manufacturing Sector in Tanzania 68
Figure 82: Percentage of firms identifying an inadequately educated workforce as the main obstacle
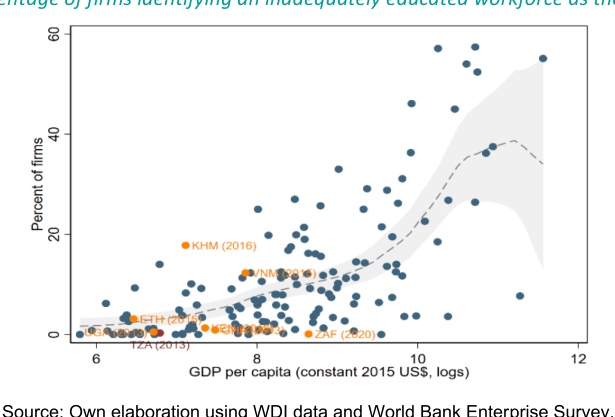
Source: Own elaboration using WDI data and World Bank Enterprise Survey.
A recent expansion in the supply of education (measured by years of schooling and proportion of individuals with tertiary education) is positively correlated with value added per worker in the manufacturing sector. If human capital is constraining manufacturing output, then increases in human capital should be accompanied by increases in manufacturing output. In Tanzania, the years of schooling of the working-age population almost doubled in the last three decades (from 4.2 in 1990 to 7.1 in 2021). During the same period, the manufacturing value added per person increased 2.3 times. There is a positive relationship between years of schooling and the manufacturing value added per capita in Tanzania, Cambodia, and Uganda (Figure 83, Panel A). For South Africa and Kenya, the slope indicates a lower increase in the manufacturing sector despite the rise in schooling. Using the share of individuals with tertiary education as a proxy of education supply, we observe a positive relationship between both variables (Figure 83, Panel B).
Figure 83: Education supply and manufacturing value added per capita
A.- Education supply as years of schooling B.- Education supply as share of tertiary
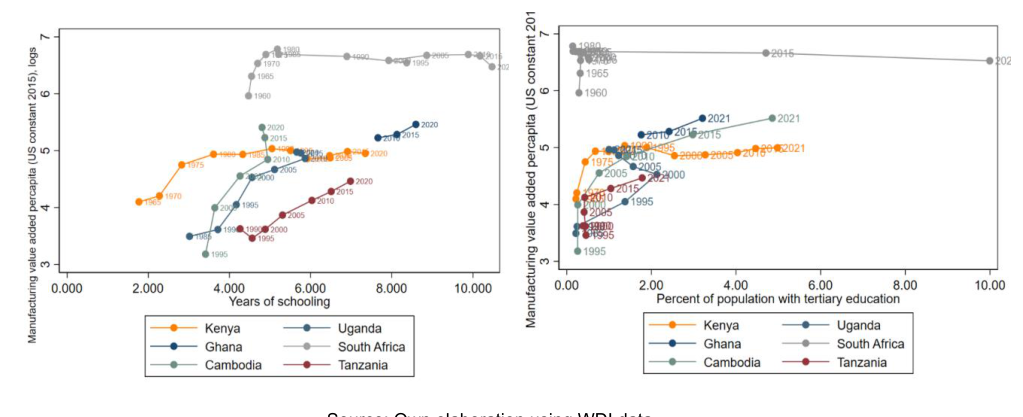
Source: Own elaboration using WDI data.
Foreigners working in Tanzania are heavily concentrated on high skill jobs and there is evidence indicated that they operate as complements – rather than substitutes – for Tanzanians. Recent changes in the law to facilitate the hiring of foreigners allows us to observe Report Growth Diagnostics and Competitiveness Study of the Manufacturing Sector in Tanzania 69
the impact of an increase in the supply of skills on output. When human capital is a barrier to growth, another way to address the lack of qualified workers in the short term is to import skills by hiring foreign workers. In Tanzania, there are large differences in the composition between domestic and foreign workforce, with the latter heavily focused on high skill. According to ASIP, by 2015 the proportion of foreign workers with a tertiary and STEM degrees was considerably higher compared to Tanzanian workers (Figure 84), which indicates they are complement the Tanzanian workforce rather than substitute for it.
In 2015 the parliament passed a law 78 to curb foreign employment in response to the increase of skilled and semi-skilled ex-pats. The instrument was overturned by the 2021 Written Laws 79 , which amended the Non-Citizens Act of 2015. The changes included an extension for work permits of non-citizens from five years to eight years, and incentives for registered investors 80 who have been granted and can employ up to ten non-citizens without being subject to the conditions of the Act of 2015. This means there is no strict condition of qualification for the ten non-citizen employees for the registered investors. We don ’ t have data to estimate the impact of this law, but the reversal suggests that withdrawing access to their foreign skills was seen as a potential constraint.
Figure 84: Distribution of engaged workers by origin (2015)
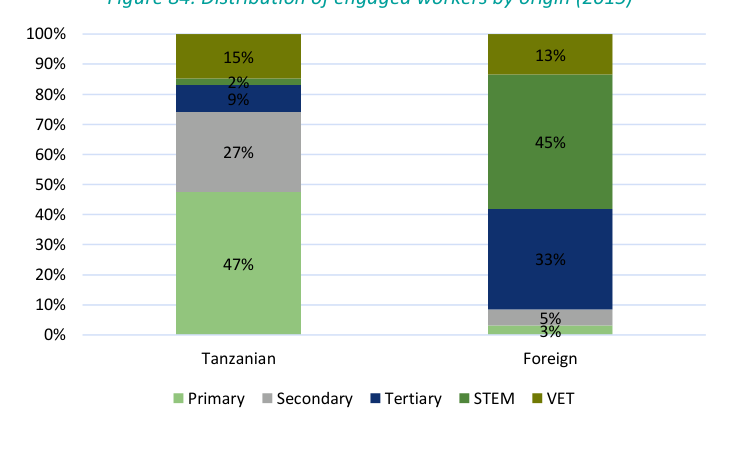
Source: Annual Survey of Industrial Production.
The proportion of firms offering formal training in the manufacturing sector is higher than expected for the level of income, but this proportion decreased moderately from 2006 to 2013. Figure 85 indicates the relationship between the share of manufacturing firms offering formal training to their workers and the income per capita. According to the figure, in 2013, 34% of the manufacturing sector firms offered formal training for their workers. Tanzania is located over the expected value given its income, and above four peer countries (Ethiopia, Vietnam, Cambodia, and South Africa).
Report Growth Diagnostics and Competitiveness Study of the Manufacturing Sector in Tanzania 70
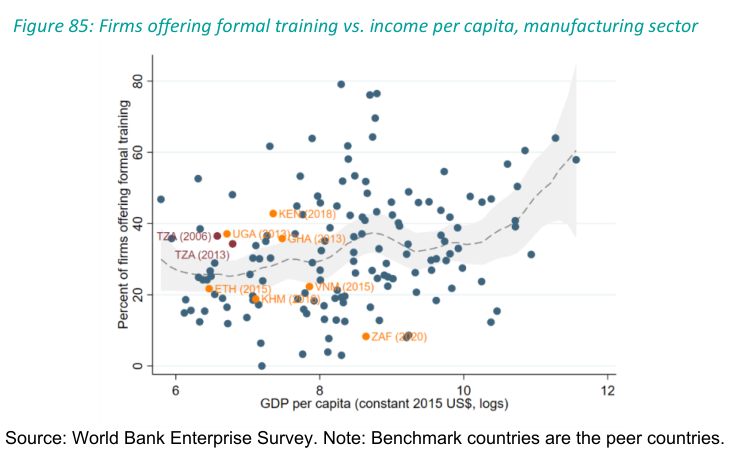
Source: World Bank Enterprise Survey. Note: Benchmark countries are the peer countries.
Growth in the manufacturing sector has come from subsectors that do not require large proportions of high skill workers. If human capital is a binding constraint, we would see firms moving away from skill-intensive to capital-intensive industries. Tanzania is a low-income economy specialized in sectors requiring less human capital. But there is no clear relationship between sector growth and human capital intensity. Some sectors with low intensity on human capital are growing but others are not, and most education-intensive sectors are relatively small and growing very little (Figure 86). When considering employment changes as a proxy of job creation in each subsector, we observe that there is no a clear relationship with the proportion of workers with tertiary education.
Figure 86: Employment change, value added and workers with tertiary education, by subsector
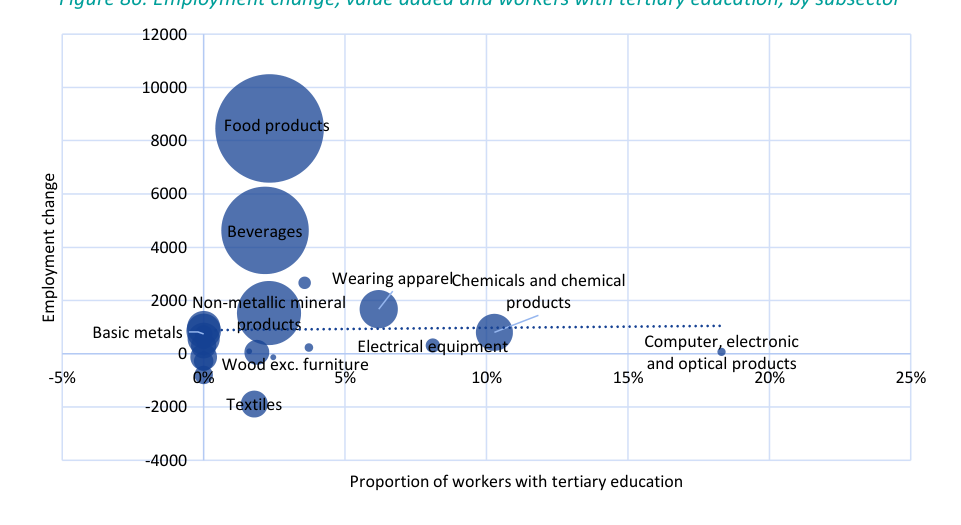
Sources: ILFS 2020/21 and UNIDO ISIC 4 database. Note: The size of the circles represents the value added in 2019.
Report Growth Diagnostics and Competitiveness Study of the Manufacturing Sector in Tanzania 71
Despite some symptoms uncovered by our set of tests, the preponderance of evidence suggests that human capital is not the most binding constraint to growth in the manufacturing sector in Tanzania. Educational attainment is expanding, and the economic returns to education are shrinking and are particularly low in the manufacturing sector. The unemployment rate among those with secondary education is high, and for those with tertiary education is rising quickly in the face of increasing supply. Moreover, the availability of skills is one of the least mentioned major constraints among Tanzanian firms. Fewer firms are offering their own training to compensate for insufficient public training, and there is no relationship between sector dynamics and educational attainment.
It is true that there is more work to be done to improve educational quality in Tanzania, as well as enrollment at the higher levels of education. Moreover, there is some evidence that the returns to vocational education are high and unemployment low and falling for that group in the manufacturing sector, suggesting that vocational training may be undersupplied, along with pressure from firms to ensure access to importing the skills of foreign workers. If the supply of technical education were particularly binding, we would expect clearer signals – such as more firms complaining about it and production tilting away from sectors that need it. As such, human capital does not appear to be the principal limiting factor for manufacturing growth in Tanzania.
Report Growth Diagnostics and Competitiveness Study of the Manufacturing Sector in Tanzania 72
2.4. Government Failures – Macroeconomic Risks
Low returns to investment in manufacturing could be caused not by low social returns to such investment, but rather by the inability of investors to appropriate those returns via government failures – including macroeconomic failures. Tanzania’s monetary policy has maintained a stable inflation rate since the mid-1990s and according to established objectives was aimed at supporting sustainable growth and price stability. In the context of a free market economy, a private banking sector, and a free-floating exchange rate regime, Tanzania successfully implemented its macroeconomic policy over the past two decades, committing to its monetary mandate and reducing fiscal dependence on the Bank of Tanzania. However, several advances will be required to improve the current monetary policy transmission mechanisms and further develop the financial sector (IMF, 2022). This section explores the main features of Tanzania’s monetary policy, exchange rate dynamics, and external debt.
The Bank of Tanzania outlines the money supply as a monetary policy tool, keeping inflation at its target during the last two decades. Central Bank independence and the reserve money targeting framework implemented in 1995 allowed to control inflation and consolidated the reduction of public sector funding. The use of the money supply as the operative monetary tool was determined by Tanzania’s context in the mid-1990s, where an interest rate-based approach was unsuitable in an underdeveloped financial system, similar to many developing countries (Kessy et al., 2017). Following these reforms, monetary policy successfully reduced inflation in the late 1990s and kept it under 16% annually for 25 years. Moreover, Tanzania has achieved greater price stability than its peers (Figure 87).
Figure 87: Inflation and monetary framework
Inflation, consumer price Bank of Tanzania’s monetary framework (annual change)
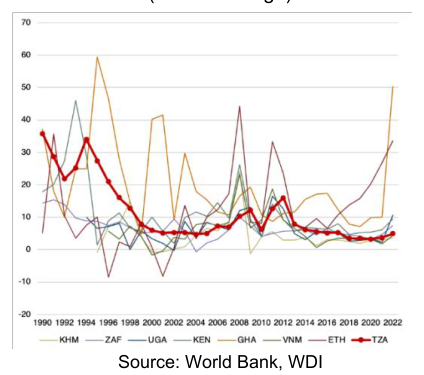
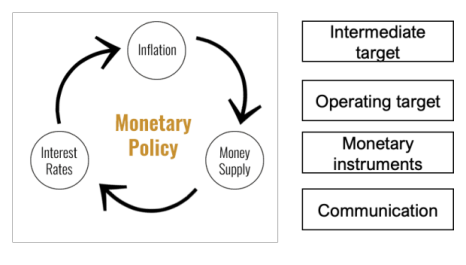
Source: World Bank, WDI Source: Bank of Tanzania The Bank of Tanzania maintains a variety of operating targets for its monetary policy. With the primary objective of maintaining price stability to support economic growth and provide adequate liquidity (Figure 87), the central bank conducts diverse operative interventions to achieve its medium-term inflation targets. Indeed, the Bank of Tanzania controls the growth of the reserve of money, which has consistently fed through to levels of private credit and interest rates (Figure 88). In addition, the Bank manages market-based instruments, such as local and foreign currency operations, REPOs, and reverse REPOs 81 (Figure 88). These transactions reach monthly amounts of 20% of the total value of the stock market capitalization, representing 2% of the GDP of Tanzania. Finally, the Bank of Tanzania defines other explicit targets, such as private sector credit growth and maintenance of adequate official reserves to cover projected imports of goods and services (Bank of Tanzania, 2020).
81 Other interventions correspond to the statutory minimum reserve requirement ratio (SMR) and discount rate are also part of monetary policy instruments. There are also standby credit facilities — intraday and Lombard loan facilities.
Report Growth Diagnostics and Competitiveness Study of the Manufacturing Sector in Tanzania 73
Figure 88: Monetary policy and monetary aggregates
Money supply (M3), private credit, and interest Market-based operations rates (annual change)
(percentage)
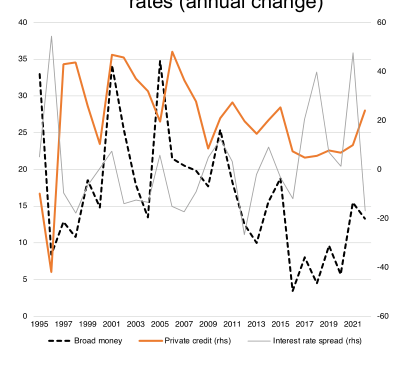
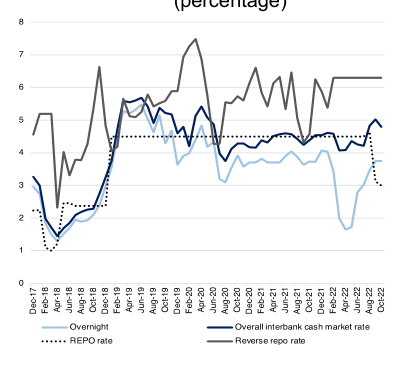
Source: World Bank, WDI and Bank of Tanzania Source: Bank of Tanzania Monetary policy is consistent with interest rate and private credit dynamics. However, the money supply tool is not efficient enough in the current context. Figure 88 shows a relatively consistent correlation between the monetary instrument (M3) and the different monetary aggregates. Since 1995, there has been a strong positive correlation between broad money and private credit (Figure 89). However, the negative correlation between the monetary supply and the interest rate spread is small (Figure 89), pointing to the potential inefficiencies in the transmission mechanisms of monetary policy. In 2018, the IMF recommended that Tanzania transition to an interest rate-based framework, aiming at improving the transmission of monetary policy and the convergence with the African Monetary Union (IMF, 2022). The main concerns are related to the pass-through of the monetary policy due to the money supply-based policy, which implies high volatility in interest rates, excess of banks reserves that hampers financial intermediation, and less efficient price-setting, i.e., limited transparency (IMF, 2022). Figure 90 shows a rough measure of the pass-through for Tanzania and its peers using the ratio of lending and T-bill interest rates standard deviation. The measure shows high volatility in the interest rate (low ratio), which can be associated with the lack of efficiency in transmitting the short interest rates to the long-term rates.
Figure 89: Money supply, credit growth and interest rate spread
Money supply and private credit growth Money supply and interest rate spread (annual change)
(annual change)
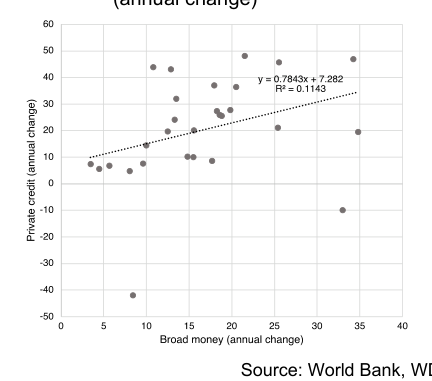
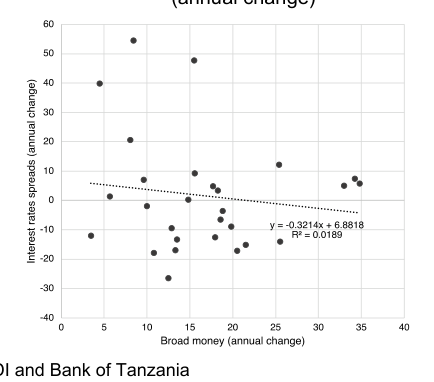
Source: World Bank, WDI and Bank of Tanzania Report Growth Diagnostics and Competitiveness Study of the Manufacturing Sector in Tanzania 74
Tanzania has a flexible but relatively stable exchange rate regime, with minor central bank interventions to reduce currency volatility. Since the mid-1990s, together with monetary policy reforms, Tanzania has presented a flexible exchange rate regime by removing controls over the monetary and exchange rate markets. Figure 90 compares the exchange rate dynamics for Tanzania with respect to its peers, showing relative stability and quite gradual changes. Besides, one of the objectives of the Bank of Tanzania is to maintain its level of foreign reserves equal to the projected monetary value of four months of goods and services imports (Bank of Tanzania, 2020). Figure 91 shows this trend in the peer countries and the world: Tanzania has a high level of reserves compared to its peers but is below the world average.
Tanzania’s exte rnal debt is similar to its peers, with the central government serving as the primary issuer and the multilateral organizations as the principal creditor. Tanzania’s external debt stock was 42% of the GDP in 2021, which is consistent with the peers’ averag e (Figure 91). At the same time, external debt reached 70% of the country’s total debt, with the government being the primary issuer of the stock (73%). The main creditor of foreign debt is multilateral organizations (46%), followed by private commercial institutions (29%).
Figure 90: Interest rate volatility and exchange rate
Interest rate volatility (St. dev. of lending)/(St. dev. of T-bill)
Exchange rate (base 100 = 2010)
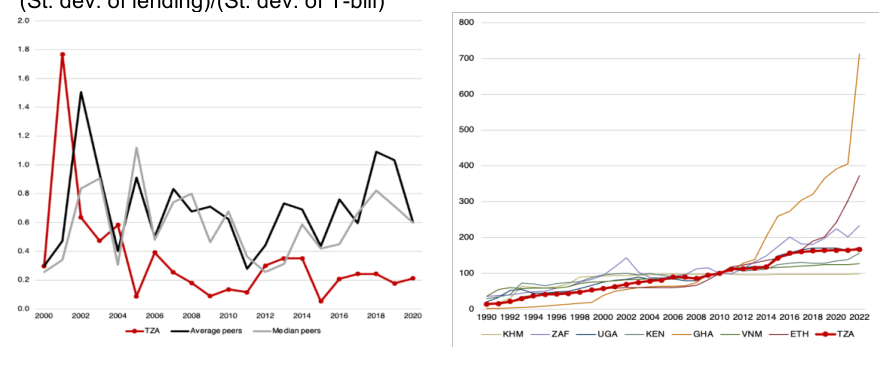
Source: International Monetary Fund (*) Annual average based on a monthly average.
Source: Bank of Tanzania
Figure 91: International reserves and external debt
Foreign reserves (months of imports)
External debt (share of GDP, 2021)
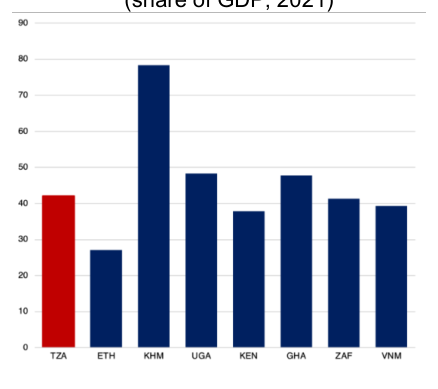
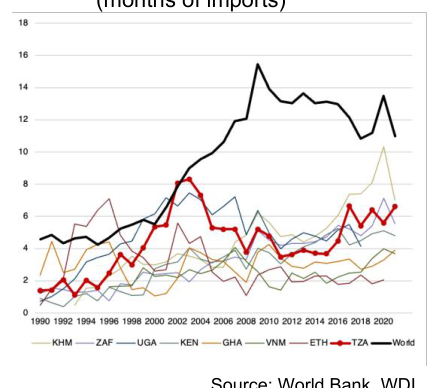
Source: World Bank, WDI.
Report Growth Diagnostics and Competitiveness Study of the Manufacturing Sector in Tanzania 75
There is no evidence of macroeconomic failures holding down the appropriability of highreturn investment in Tanzania, though challenges remain in financial market development. Tanzanian macroeconomic policy has led to stability in the macroeconomic aggregates in the last decades. However, several challenges persist in the financial sector. The IMF’s 2018 Financial Sector Assessment Program report emphasized the issues of commercial banks’ concentration, dollarization of banks’ liabilities, undercapitalization of small banks, and financial risk associated with non-performing loans (NPLs) due to under provision and restructuring of loans (IMF, 2018). All these problems may be exacerbated in the aftermath of the COVID-19 pandemic. As such, recommendations point policy reform in the direction of improving financial stability, surveillance in the financial markets, and data collection, enhancing banking supervision and modernizing the monetary policy framework 82 .
2.5 Government Failures – Microeconomic risks
In addition to the macroeconomic environment, the government has a significant role to play in ensuring that investments generate returns through sound microeconomic management. Government rules and regulations of critical factors of production such as land and labor, as well as a general tax and regulatory environment free of crime and corruption are key determinants of the appropriability of investment returns.
2.5.1. Land regime
The property land system can act as a barrier to growth of the manufacturing sector through different channels. Weak land property rights hinder investment in land-intensive industries through increased risks of losing their rights over property. Moreover, weak land regimes can affect access to finance. Land tends to serve as collateral, but banks would not accept insecure properties that cannot be transferred in the event of default.
The current land property regime does not facilitate access to land for investment. The land regime in Tanzania is codified in the Land and Village Acts of 1999. The law recognizes three categories of land: village land, general, and reserved 83 . The general land is surveyed land usually located in urban or semi urban centers and comprise just 2% of the total land. The village land is usually located in rural areas in Tanzania, managed by the Village Council and accounts for 70% of total land. Most of it is not surveyed. Reserved land includes national parks, forest reserves, and other natural reserves comprising 28% of total land. The Land Act confers the use of land to the president of the nation, but citizens can obtain two types of occupancy rights. First, the customary right of occupancy (CCRO), which can be held in rural areas indefinitely. Once land is surveyed, these certificates are issued by village councils. Second, the Granted Right of Occupancy (GRO), which can be granted for 99 years and held outside village lands. To obtain the certificate of use, the land must be surveyed. Village lands cannot be used for investment. Thus, all lands for investments must be transferred into general land. The transfer of land from Village to General categories can only be done by presidential consent, and compensation. As a result, acquiring land for investment is a complicated and lengthy process (FYDP II, 2016), and access to land remains as an important challenge for investment, especially for agribusiness sectors (OECD, 2013; Dinh & Monga, 2013).
Time and the number of procedures required to register property in Tanzania are among the highest in the comparison group, and rank above the regional average. Tanzania has the lowest overall score on registering property in relation to its peers, the second highest number of procedures involved to register a land, the highest number of days to register a property, and the second lowest quality of land administration (Figure 92).
Report Growth Diagnostics and Competitiveness Study of the Manufacturing Sector in Tanzania 76
Figure 92: Registering property indices from WORLD BANK Doing Business Indicators (2020)
Registering a property (score 0-100) Number of procedures to register land
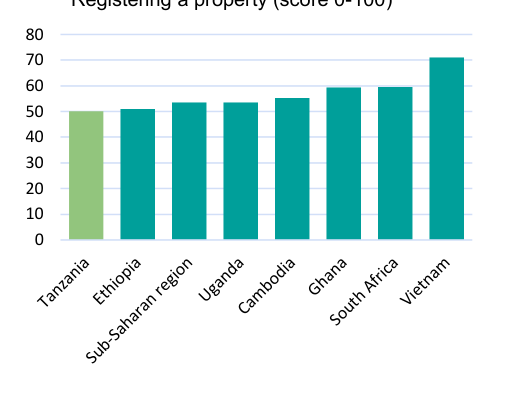
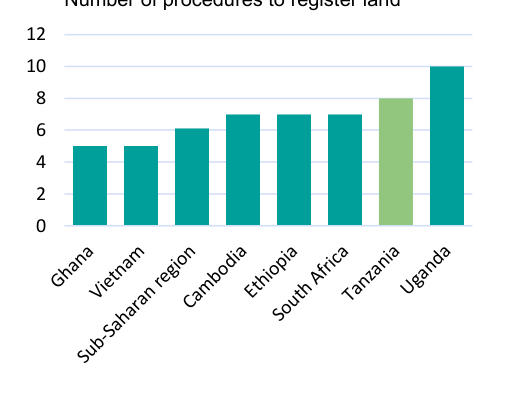
Time (days) Quality of land administration index (0-30)
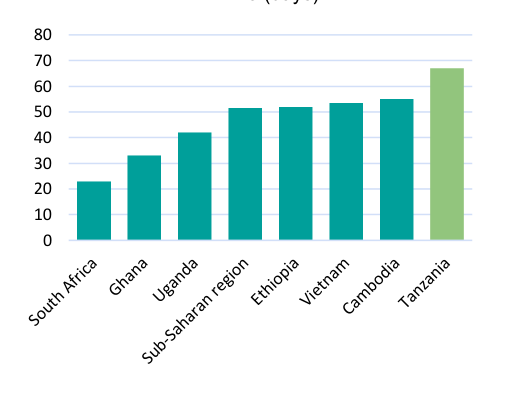
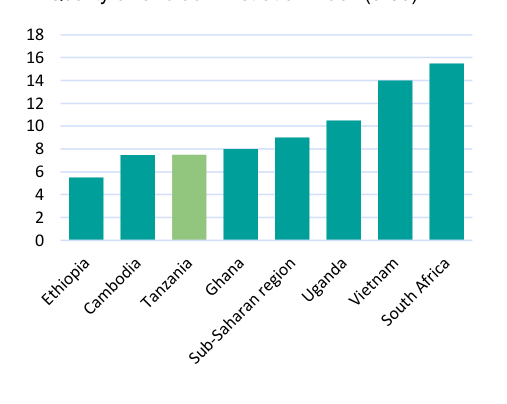
Source: WDI data. Notes: the indicators come from the World Bank Doing Business project, which was discontinued in 2021.
The share of total land that is surveyed and titled is very low in Tanzania, which has a differential impact on small holders. By 2020 only 20% of the land had been surveyed (FYDP III, 2021). Despite Tanzania having established legal framework for facilitation of land registration, in practice most of the land in the country is not titled, and registered titles accounted for less than 5% and most of that was registered in urban areas (USAID, 2013). Land registration and titling is a complicated and relatively expensive process that cannot be completed by most citizens. This would explain why rural land in Tanzania has remained in customary tenure system without formal documentation (Aikeli & Markussen, 2022). The lack of land ownership inhibits growth as welldocumented property rights facilitate the use of land as collateral thereby easing access to credit (Aikeli & Markussen, 2022; Dinh & Monga, 2013). According to the Industrial Development Strategy 2025, the major bottleneck for financial access lies in the legal land framework, as 80% of the land in the country is not surveyed and cannot be used as collateral.
Report Growth Diagnostics and Competitiveness Study of the Manufacturing Sector in Tanzania 77
Access to land can be even more complicated for foreign investors. The current legislation only allows ownership of land by citizens and restricts that of foreigners, who can only access a derivative right through the Tanzania Investment Centre (TIC). TIC is an investment facilitator established in 1997 by the Tanzania Investment Act, aimed at encouraging, promoting, and facilitating investments in Tanzania 84 . Though TIC maintains a land bank, according to the OECD, very little land is readily available on it – plots available are too few and too small – affecting specifically large-scale agricultural investors (OECD, 2013). For most rural plots that are not in the land bank, foreign investors must wait for the transfer from villages land to general land. This is a lengthy approval process, that relies on several authorities (local-level authorities, the Ministry of Lands, Housing, Human Settlement s Development, and the President’s Office) 85 . Once the land is converted, the foreign company can obtain a derivative right through TIC (if the majority of shareholders of the company are non-citizens) or a right of occupancy (if most of the shareholders of a company are citizens). According to Vernmeulen and Cotula (2010), investors’ main complaint is the length and uncertainty that surround the allocation of land.
The Enterprise Survey suggests that land access is more restrictive in Tanzania than in peer countries, but also that other factors are more binding than land for manufacturing firms. The ratio of manufacturing firms mentioning land as the main obstacle is about 4% 86 . Finance and electricity were selected as the main barriers in the manufacturing sector, with 7-to- 10 times more mentions as the main obstacles (40% and 30%, respectively) 87 . Moreover, the proportion of firms indicating land as the main obstacle is below that of some peer countries (Ethiopia, Uganda, Ghana, and Vietnam), and decreased from 3.9% in 2006 to 3.6% in 2013 (Figure 93). When disaggregating within the manufacturing sector, in the food subsector land seems to be a more relevant obstacle (6%). For the furniture subsector, and textiles and garments the proportions are 3.7% and 2.7%, respectively. When considering firms with 10% or more foreign ownership, the proportion of firms indicating land as a main obstacle is 3.4%, which is a low proportion compared to other obstacles indicated by firms. Nevertheless, the relative positioning of Tanzania changed in between the two surveys (2006 and 2013), and in the latter the country was ranked as second among peers with the highest proportion of firms indicating land as a major barrier.
Figure 93: Percent of firms indicating land as the main obstacle
A. Manufacturing firms B. 10% or more foreign ownership |
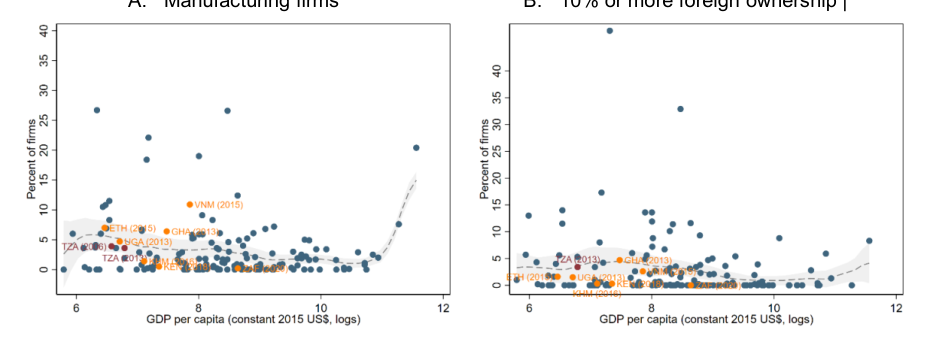
Source: Self-elaboration using WORLD BANKES.
84 In 2022, to recognize the reforms undertaken by the Government on investment, Tanzania has repealed the Investment Act, and replaced it with the New Investment Act. According to the New Tanzania Investment Act No. 10 of 2022, TIC deals with foreign-owned firms with a minimum capital investment of USD500,000 and local-owned firms with at least USD $50,000. 85 For more information see the following link . 86 Considering all the firms in Tanzania (including other sectors) land is a more relevant obstacle, and it has worsened from 2006 to 2013. The proportion of firms considering land as main obstacle was about 2.6% in 2006, increasing to 5% of the firms in 2013. 87 For more information see Appendix 17: Main obstacles for firms, manufacturing sector Tanzania.
Report Growth Diagnostics and Competitiveness Study of the Manufacturing Sector in Tanzania 78
Issues surrounding access to land have a differential effect on land-intensive industries such as agriculture but can also be a potential limitation for the development of the manufacturing sector, particularly foreign and exporting firms . Another indication that the current land delivery system discourages investment is the difficulties that even governmentsponsored Export Processing Zones (EPZs) face when acquiring land (USAID, 2011). In 2002, EPZs were established as a policy to promote export-led industrial development, by addressing infrastructural and institutional constraints (EPZs Act, 2002). In 2006, the government of Tanzania established the Export Processing Zones Authority (EPZA), with the goal of providing infrastructure and tax incentives to attract investors. The same year, the Special Economic Zone (SEZ) program was established under the SEZ Act. This scheme was intended to fast-track economic growth and poverty reduction and involved other sectors than manufacturing. In 2011, EPZA’s responsibilities expanded, including the oversight of the Special Economic Z one (SEZ). The new regulation was intended to rationalize the roles of EPZA and place both regimes (EPZ and SEZ) under one body. EPZA is allowed to issue derivative rights to investors (as TIC). The government allocated thirteen sites for SEZs, out of which just a few were operational at the time of writing and only the one at Dar Es Salaam was serviced and at full capacity. There are five projects at relatively early levels of development, each requiring investor development rather than turnkey plots 88 . According to MITIs, one important constraint harming the implementation of EPZ and SEZ schemes is the non-availability of serviced land, and the payment of compensation in acquiring industrial land (Kweka, 2018). According to the Industrial Development Strategy 2025 land acquisition is one of the most complicated and time-consuming segments of the process to develop industrial parks. On top of that, sectoral analysis to promote lighting manufacturing identified six main constraints that impede competitiveness in the sector, including the access to industrial land as a crucial constraint on agribusiness (Dinh & Monga, 2013).
2.5.2. Labor regulations
Tanzania shows high rates of labor participation and low unemployment relative to peers, displaying a stable and small share of industrial workers since 2005. The country shows a high share of working-age population active in the labor force (80%), the highest level among the benchmark countries (Figure 94). By 2020 the unemployment rate was relatively low (2.8%), only higher than Cambodia and Vietnam (Figure 94). However, it is worth stressing that labor trends and economic structure are a consequence of Tanzania’s low -income status. In fact, these trends are explained by high poverty and levels of occupation in the subsistence economy (Adams et al., 2013), the prevalence of the agricultural sector and high labor informality. Although the share of workers in agriculture has declined from 85% in 1990 to 65% in 2021, it has decreased at a lower rate than the sector’s contribution to GDP ( which went from 50% in 1987 to 28% in 2010) 89 .
Figure 94: Labor market indicators
Labor force participation rate, total Unemployment rate (percentage of the total labor force)
(percentage of pop>15)
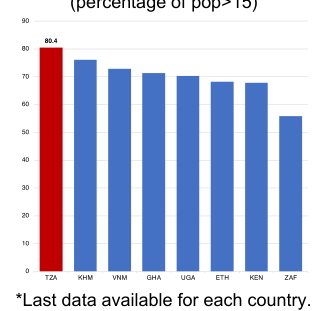
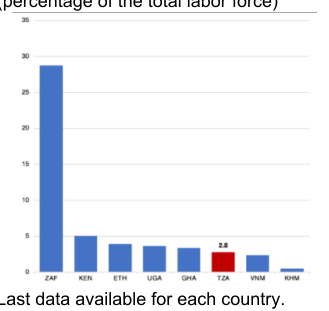
*Last data available for each country. Source: WDI and ILO *Last data available for each country. Source: WDI and ILO Report Growth Diagnostics and Competitiveness Study of the Manufacturing Sector in Tanzania 79
The informal sector is a significant part of Tanzania’s economy and employment, representing close to 50% of GDP. According to Kawar (2017), the Tanzanian economy is highly dependent on the informal sector, which represents roughly 22% of total employment for 2016 (4.3 million workers), 29% by 2021 according to the Tanzania National Bureau of Statistics. The sector is mostly characterized as urban (80%), with an overrepresentation of women in lower-paid jobs but a dominant and increasing share of male informal workers in trade and extractive areas. Using the estimations of the World Economics Informal Economy Database, the informal economy represents 46.7% of the GDP of Tanzania.
Structural change in Tanzania has been accompanied by an increase of informality in the manufacturing sector. Diao et al. (2021) documented that the growth acceleration in Tanzania and Ethiopia coincided with a rise in the informal employment in the manufacturing sector. This phenomenon contrasts with what occurred in other Asian countries such as Vietnam and Taiwan. Accordingly, the proportion of informal workers in the manufacturing sector in the latest version of the household survey (ILFS, 2020/21) was 77%; ranking 5 th among all sectors 90 .
Tanzania’s labor market regulations are not restrictive in relative terms as described by the most recent Global Competitiveness Index. Tanzania has 8 out of 10 Fundamental Conventions, 1 out of 4 Governance Priorities and 37 conventions ratifications in 2022-2023 with the ILO 91 . The latter is reflected in the Global Competitiveness Index (Schwab, 2019), positioning Tanzania with high labor market standards (Figure 95). Tanzania scores 86 score (out of 100) in overall market regulations, the highest of benchmark countries. Similarly, it ranks high in worker rights, and redundancy costs. The most restrictive aspect of labor in Tanzania seems to be related to hiring foreign workers. That feature responded to the Non-Citizens Act of 2015, which introduced significant restrictions to hire non-residents, and was amended in the 2021 Written Laws 92 . Other dimensions of labor regulations such as labor tax rates and hiring and firing practices seem to be more restrictive in Tanzania than in most peers.
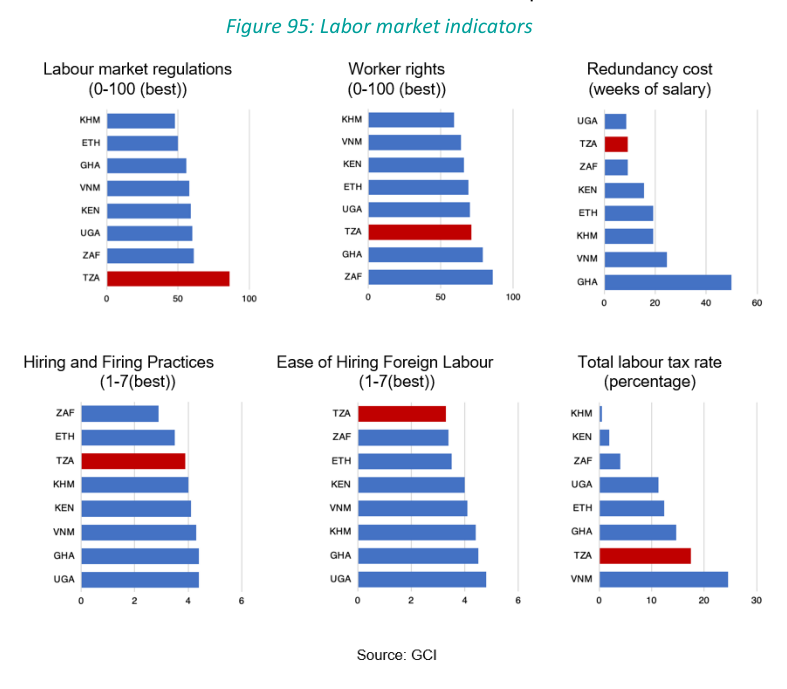
Report Growth Diagnostics and Competitiveness Study of the Manufacturing Sector in Tanzania 80
The minimum wage in Tanzania ranks in the middle of the distribution of peer countries. Tanzanian minimum wage is roughly USD 50 monthly (Figure 96, Panel A), ranking below South Africa (USD 291), Kenya (USD 288) and Vietnam (USD 183). Nevertheless, in practice, the authorities legislate based on differentiated minimum wages depending on the economic sectors. For instance, minimum salaries range between USD 43 (agriculture and private school services) to USD 172 (telecommunications, mining, international companies, and financial institutions) 93 . In 2022, the Ministry of State and the Labor Broad updated the minimum wage, increasing it by 36% on average for all sectors effective January 2023.
Average wages and labor costs are somewhat high in Tanzania for its level of income The level of wages of Tanzania is low by international standards, but higher when compared to regional peers in the benchmark group (Figure 96, Panel B and D). On average, the Tanzanian monthly average earning per worker is USD 186, higher than Uganda (162), Ghana (159), Kenya (137) and Ethiopia (72).
Within the manufacturing sector, Tanzania’s wages rank below those of Asian peers and South Africa, but well above the remaining African peers. When considering all sectors, Tanzania has an intermediate average income (USD 186), well below the high-income countries in the benchmark group (Cambodia, Vietnam, and South Africa), similar to Kenya, Ghana, and Uganda (Figure 96, Panel B). The manufacturing average income is USD 141, below the general average wage in Tanzania (USD 186). Moreover, Tanzania’s manufacturing income level is below the Sub-Saharan region, with a monthly average of USD 206, and its below Asian peers and South Africa levels (Figure 96, Panel C). Nevertheless, it is well above the remaining African peers Ethiopia, Ghana, and Uganda with average manufacturing income of USD 60, USD 78, and USD 79 respectively.
In terms of attracting foreign investment to manufacturing, formal wage levels in Tanzania don’t seem to be a competitive advantage. Using a panel data from the World Bank Enterprise Survey, Gelb et al. (2020) find that industrial labor is relatively more expensive for firms in the Sub-Saharan region than other regions. There is high heterogeneity in the region, and there are some countries more attractive for investment in labor-intensive competitive manufacturing, particularly considering productivity levels and potential scale. The most appropriate candidate is Ethiopia, which has seen significant investment and job creation by such firms, particularly in the garments sector. Tanzania on the other hand has the highest monthly average wage in its peer group, excepting South Africa and East Asian comparators. Moreover, a recent study provides evidence of inefficiencies in the allocation labor, with labor costs being higher inside state-owned EPZs and SEZs (Kinyondo, 2016).
93 See Appendix 20: Monthly minimum wage by sector Tanzania (2020) USD. Table obtained from the following report: link .
Report Growth Diagnostics and Competitiveness Study of the Manufacturing Sector in Tanzania 81
Figure 96: Wages, Tanzania and peers
A.- Monthly minimum wages (USD)
(USD)
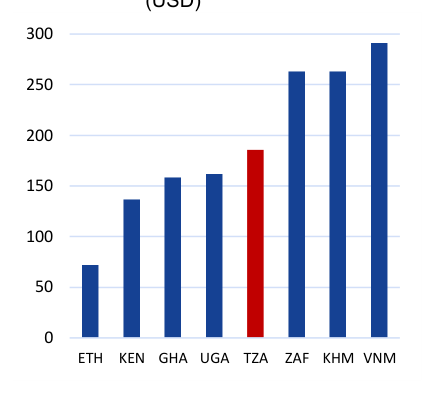
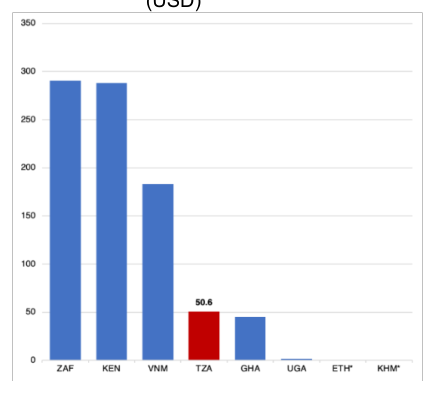
C.- Average monthly average (USD), manufacturing sector
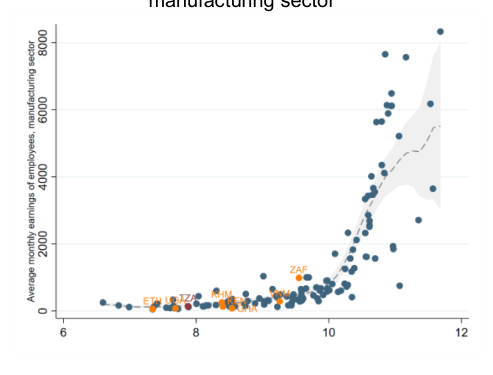
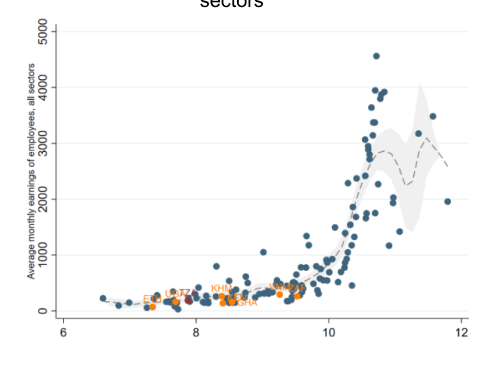
Source: ILO. Last data available for each country.
Labor-intensive industries are not smaller and do not grow slower than less-intensive industries in the manufacturing sector in Tanzania. If labor regulations were a binding constraint, we would expect to see less labor-intensive industries thrive and the more laborintensive industries struggle. When considering employment intensity as the division of employees over total value added by firm, we observe that there is no clear correlation between employment intensity and total value added or growth (Figure 97, Panel A & B). Though it does not suggest labor regulations are particularly binding, given Tanzania’s status as a low -income labor-abundant country, all else equal one would expect greater specialization in labor-intensive production.
Report Growth Diagnostics and Competitiveness Study of the Manufacturing Sector in Tanzania 82 B.- Monthly average wage D.- Average monthly average (USD), all sectors
Figure 97: Value added by industry and employment intensity (percentile), by ISIC4
A. Total value added 2019 (logs) B. Average annual growth rate, %
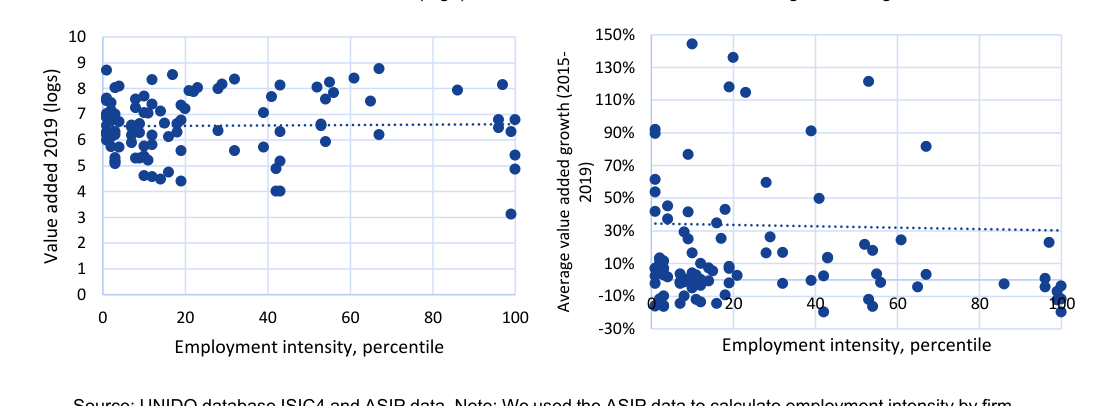
Source: UNIDO database ISIC4 and ASIP data. Note: We used the ASIP data to calculate employment intensity by firm as the share of employees over the total value added of the firm. Then we average by 4-digit ISIC and rank by intensity.
2.5.3. Tax regulations
Tanzania’s tax revenues have been relatively stable at 12% of GDP for two decades, which is low by international standards. The Tanzania Revenue Authority (TRA) is the public agency that oversees income tax, VAT, import duty, excise duty and stamp duty collection since 1995. Tanzania’s tax revenues have slightly increased from the early 2000s, averaging 12% of GDP in the last two decades (Figure 98), but remain slightly below the level one would expect for its level of income 94 . There are some significant trends below the stable size of public income, with the share of income taxes and non-tax revenues increasing within a structure still dominated by consumption taxes. As in many developing countries, Tanzania’s revenue is highly dependent on consumption taxes, with 6.9% of the GDP (59% of all tax revenues) represented by import and VAT taxes (Figure 98). On the other hand, the income tax has shown an increasing trend since 2009, reaching 27% of Tanzania’s government revenue in 2020 (4% of GDP). Non-tax revenues from natural resources such as mining, gas, forestry, and fishery have followed an upward trend 95 .
Figure 98: Tax revenue
A.- Tax revenue Tanzania (% GDP) B.- Tanzania’s government revenues
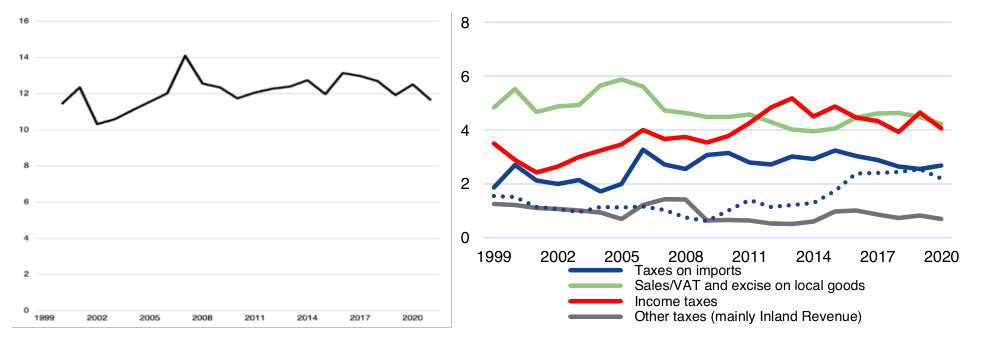
Source: WDI and Bank of Tanzania.
Report Growth Diagnostics and Competitiveness Study of the Manufacturing Sector in Tanzania 83
Tanzania’s relatively low tax take reflects poor VAT performance, which displays high rates compared to peers but low contribution. Tanzania has a sales tax of 18%, the highest in the benchmark group (Figure 99 ) . However, VAT revenues are approximately 3% of GDP (excluding imports), similar to countries with lower VAT rates such as Kenya and Uganda (Figure 99). There are many items exempt from VAT, such as several agricultural goods, machinery, and services related to health and transportation. That leaves telecommunications, beverages, and tobacco as the primary sources of VAT. Some reform efforts in tax policy have started, with the new VAT law started in 2015 that broadened the tax base by removing some exemptions. Nevertheless, more reforms are needed to close the gap with regional averages. While EAC countries collected on average 4.4% of GDP in 2011-13, Tanzania achieved only 3.3% (IMF, 2016).
Figure 99: Taxes revenues, Tanzania, and peers
A. Tax revenues (share of public B. VAT revenue (share of GDP) C. Corporate and income revenue tax revenues)
(share of GDP)
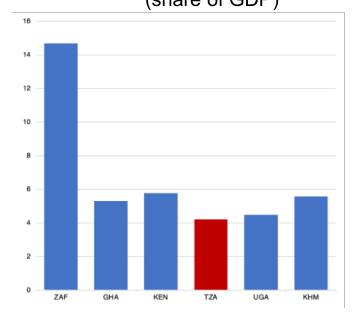
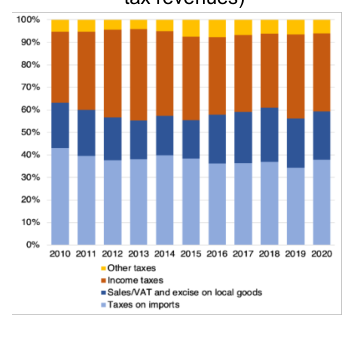
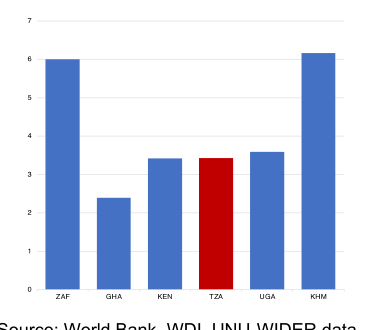
Source: World Bank, WDI, UNU-WIDER data.
Figure 100: Tax rates, Tanzania, and peers
Corporate tax rate Personal income tax rate VAT/Sales tax rate (percentage)
(percentage)
(percentage)
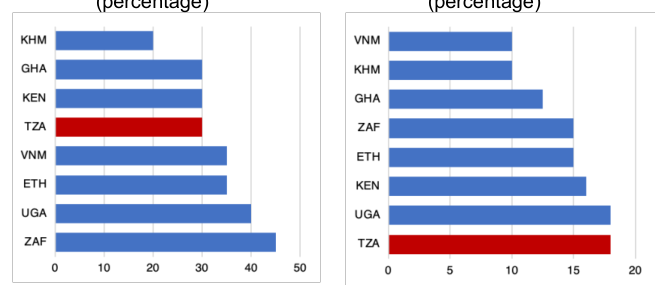
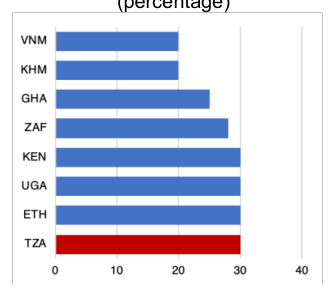
Source: OECD, World Bank, and PWC Report Growth Diagnostics and Competitiveness Study of the Manufacturing Sector in Tanzania 84
Corporate and personal income rates are high relative to peers, but collections are the lowest in the benchmark group. The corporate tax rate remains at 30% for Tanzania – in line with the East African Community (EAC) countries, but above other countries such as Vietnam, Cambodia, Ghana, and South Africa (Figure 100). Nevertheless, the operational corporate tax in Tanzania depends on deductions and exceptional cases. For example, listed stock exchange companies must pay 25%, firms with losses are subject to “Alternative Minimum Tax”, and capital deductions provisions such as depreciation allowances for assets are applicable for the agriculture, manufacturing, and tourism sectors 96 . In fact, in aggregate the GDP collection via this source is the lowest in the benchmark group (Figure 99, Panel C), similar to Uganda and Ghana. At level of businesses, Figure 101 shows a composition of firms’ share of taxes as a percentage of profits in 2020. Despite Tanzania being among the lowest in the peer group in terms of profit tax (20.9%), the country presents a high share of contribution and labor taxes reaching 43.8% of total profits and positioned as the second highest country in the benchmark group (Figure 101).
Figure 101: Taxes as a percentage of profits Total taxes (Percentage of profits)
Profit tax (Percentage of profits)
Labor and contribution taxes (Percentage of profits)
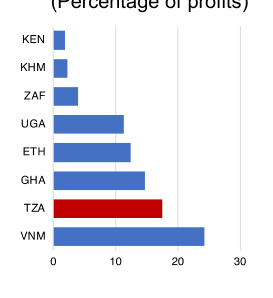
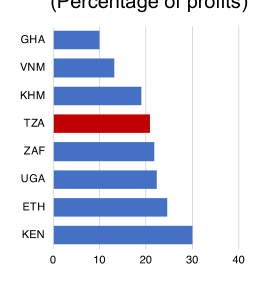
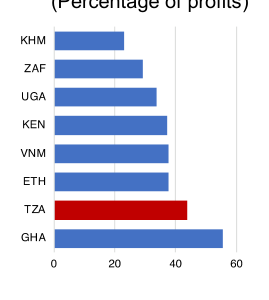
Source: OECD, World Bank, and PWC.
Low tax revenue and difficulties in tax administration are associated with tax inefficiencies, exemptions, and tax evasion. According to the IMF (2016), the tax revenue gap in Tanzania ranges from 2.2% to 2.8% of GDP, principally motivated by a combination of lack of compliance, ineffective tax administration, small tax base because of exemptions, and tax incentives. There are many exemptions to VAT for goods and services. Various calculations (Uwazu-Twaweza, 2010; Curtis and Ngwowi, 2017) show that tax incentives between 2008-2016 ranged between 6% to 2% of the GDP but with a declining rate over the years. Similarly, the TRA has documented the problem of tax evasion in Tanzania, commonly associated with a miss or underreporting of non-wage income and capital income, overestimation of deductions and erroneous file tax filing. Ali et al. (2014) shows that 50% of taxpayers in Tanzania agree with tax evasion due to bad tax administration, high general taxation levels and insufficient public goods provision.
Relatively high taxes of payroll may be a significant disincentive to formal wage employment, particularly when contrasted to generous exemptions to capital taxation in certain sectors. Currently, around 70% of the economically active population in Tanzania is out of the tax system due to their informality, with close to 50% of the workers earning below the taxable personal income. Payroll taxes include social security (20%) 97 , and a specific Skills Development Levy (SDL) of 4%. In response to significant lobby from private companies, SDL was reduced from 6% to 5% in 2013, and then 5% to 4.5% in 2016, and to 4% from July 2020 onwards. Nevertheless, SDL remains significantly higher in Tanzania than in comparable countries (SOAS, 2018; PWC, 2021). According to the ILO (2020), Tanzania’s SDL rate is the highest when compared to other countries in the region (Namibia 1%, South Africa 1%, Zambia 96 See the following link . Other special tax deductions but restricted requirements are the export processing zones (EPZs), special economic zones (SEZs) and special treatments for assemblers of vehicles, tractors, fishing boats: and new manufacturers of pharmaceutical or leather products. 97 20% rate shared 10% by employee and 10% by employer.
Report Growth Diagnostics and Competitiveness Study of the Manufacturing Sector in Tanzania 85
0.5%, and Zimbabwe 1%). Firms interviewed perceived little to no benefit of the SDL in terms of improved worker skills. This is in sharp contrast to the abundance of corporate tax incentives though generous capital deduction for specific sectors, including manufacturing, agriculture, and tourism. Manufacturers of pharmaceutical and leather products have also been recently excepted. 98 . According to Dihn and Monga (2013), this bias in favor of the application of physical capital (general tax exceptions for investment) combined with the higher taxation on labor would encourage firms to use physical capital rather than skilled workers in the manufacturing sector. Manufacturing firms identify tax rates as their main obstacle to business, at a significant distance from access to finance and electricity. According to the World Bank Enterprise Survey more than 40% of manufacturing firms indicated that finance was their major constraint, followed by electricity (30%), and high taxes 99 . The share identifying higher taxes as the main constraint jumped from 4.5% in 2006 to 8.0% in 2013, positioned as third country in the peer group (Figure 102). Moreover, in the Global Competitiveness Index 100 tax rates were considered the second most problematic factor for doing business in Tanzania in 2018. On the top of that, according to the Doing Business (2020), Tanzania was the worst positioned country in the ranking of paying taxes indicator (Figure 103), with the lowest post-filing index score in the peer group, and the worst in terms of numbers of payments during the year 101 . Nevertheless, the proportion of manufacturing firms indicating tax administration as the main obstacle is very low, representing 0.6% (Figure 102 Panel B).
Figure 102: Firms indicating high taxes as main obstacle
A. Tax rate as main obstacle B. Tax administration as main obstacle
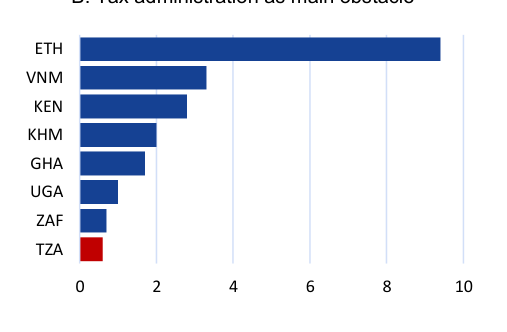
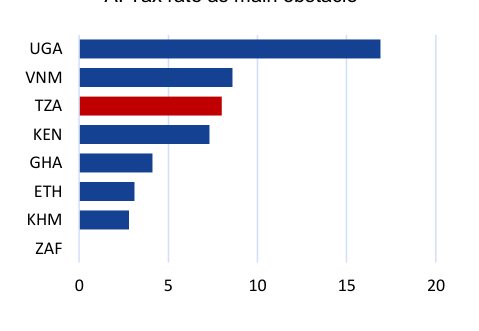
Source: World Bank Enterprise Survey data, last year available.
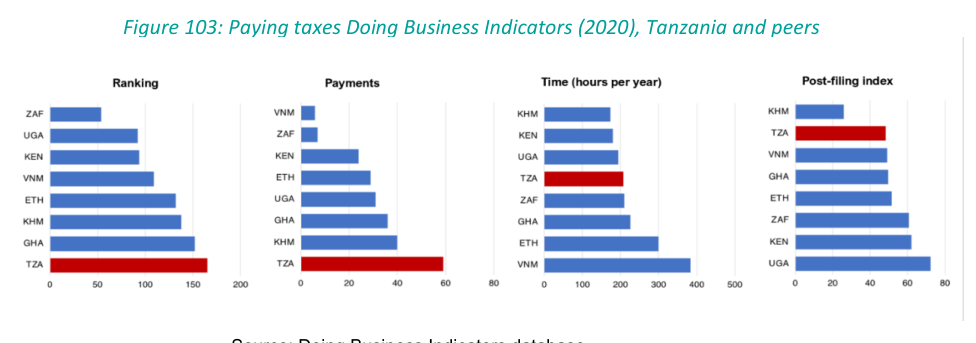
Source: Doing Business Indicators database.
Report Growth Diagnostics and Competitiveness Study of the Manufacturing Sector in Tanzania 86
2.5.4. Red tape
Red tape – a term referring to excessive regulation or rigid conformity to redundant bureaucratic rules – do not seem to be a major concern for Tanzanian firms. Only 3% of manufacturing firms considered “business licensing and permits” as their main obstacle. Although the proportion is more than expected given the level of income – and above most of the countries in the peer group (Figure 104, Panel A) – the time spent by senior management dealing with the requirements of government regulations is very low in Tanzania. Manufacturing firms considered that their senior management personnel spent 3% of their time, well below most of the peers.
Figure 104: Percent of firms indicating business licensing and permits
A. Percent of firms indicating business licensing B. Senior management time spent dealing with and permits as main obstacle the requirements of government regulations
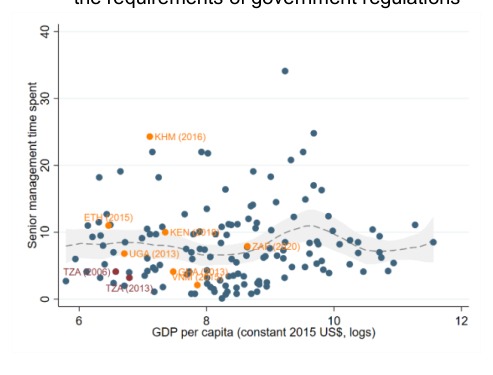
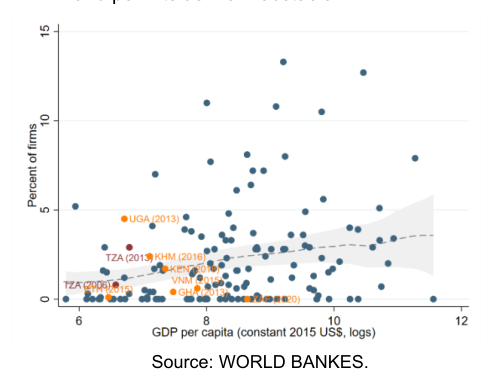
Source: WORLD BANKES.
Tanzania’s efforts to improve its regulatory environment led to significant improvements in the early 2000s but then stagnated and even deteriorated from 2015 onwards. In 2020, Tanzania was ranked 141 among 190 countries in the Ease of Doing Business report, a slight set back from 2015 when it ranked 131 102 . By these metrics, Tanzania has reduced the cost of doing business (as a percentage of GNI per capita), the number of days required to start a business, and the number of startup procedures needed to register, where Tanzania has recorded some improvement but still ranks third highest among peers and above the Sub-Saharan Africa average (Figure 105). Tanzania also has a high number of procedures that also drags down the start a business indicator, ranking just below Uganda and Ethiopia and high within the context of Sub- Saharan Africa (Figure 106) 103 . Moreover, registering a business takes more time than in most of the African peers. Other data that suggest that there are important remaining challenges for strengthening and sustaining a regulatory environment is that Tanzania ranked below most of the peers on quality regulation. All these signals were corroborated by interviews with firms, which brought up a range of challenges with red tape, particularly uncoordinated and inefficient regulatory coordination between national, district, and municipal governments.
102 See the FYDP 2021/22-2025/26 in the following link . 103 See Doing Business report in the following link .
Report Growth Diagnostics and Competitiveness Study of the Manufacturing Sector in Tanzania 87
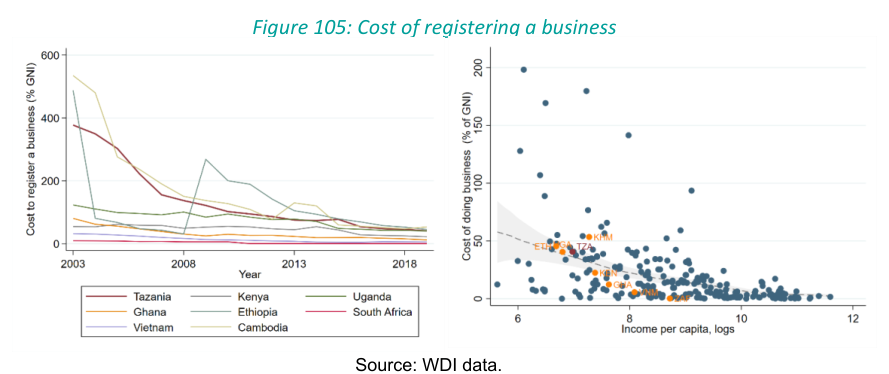
Source: WDI data.
Figure 106: Doing business indicators
A. Number of procedures B. Time(days)
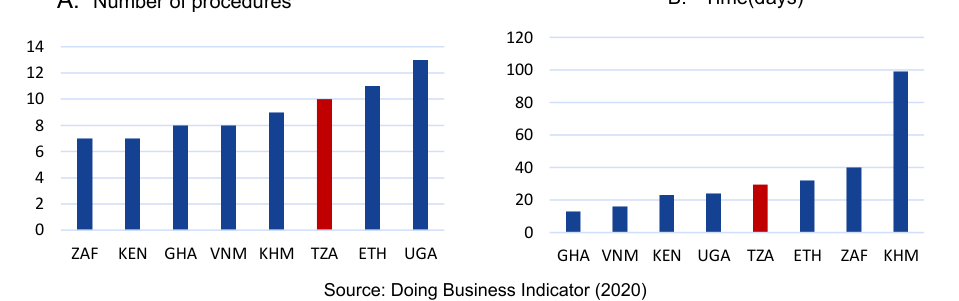
Source: Doing Business Indicator (2020)
The number of firms registered has declined despite the advances in the reduction of costs and time to start-up a business. Currently, the number of firms registering is low overall, and Tanzania ranks the lowest among peers. Just over 5,000 new firms registered in 2018, compared to 30,000 in Ethiopia and 45,000 in Kenya (Figure 107). In early 2000s, the costs of starting a business in Tanzania dropped, and at the same time the number of firms registering increased reaching a peak in 2015. This response suggests that the shadow price of the regulatory burden may have been high with respect to starting a business. Nevertheless, in recent years the numbers of registered firms have declined, despite of the continued reductions in the costs and the time required to start a business. This lack of further response may suggest that this constraint (or the way it is measured in the doing business indicators) has lost relevance.
Figure 107: Number of businesses registered and cost of business (2019-2020)
A. Number of business registered B. Number of business registered and cost
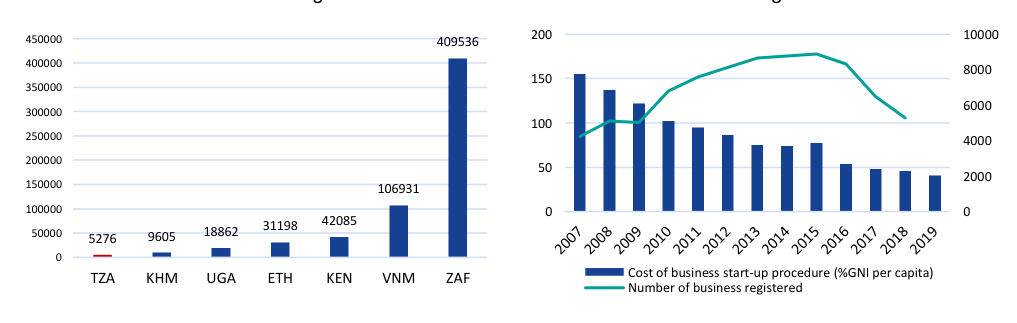
Source: WDI data.
Report Growth Diagnostics and Competitiveness Study of the Manufacturing Sector in Tanzania 88
Low levels of formal business formation are accompanied by high levels of informality. Some reports suggest the high level of informality is a driver of the low level of formal businesses registered. The latest estimate indicates informality to be around 47% of GDP, the sixth largest of all countries with available data, representing a third of employment 104 . Informality has been related to several causes of lower productivity, including difficult access to electricity, land, and lack of capital deterring micro and small firms from starting large and formal companies, among others (USAID, 2011; Aikaeli & Kalinda, 2014).
Tanzania’s national development plans have prioritized red ucing the regulatory burden and enhancing relationships with the private sector. The country’s second Five -Year National Development Plan (FYDP II, 2016) continued to prioritize reforms to improve the business environment, in particular streamlining and simplifying the process to obtain permits, licenses, and approvals for both local and foreign investors. It further abolished several fees related to starting a business and introduced electronic systems to deliver services 105 . The FYDP III (2021) has develop ed a “blueprint” alongside the private sector to further streamline process and minimize overlaps in regulatory agencies, ensure certainty and consistency in the application of regulation, and address operational inefficiencies 106 . Our interviews with firms showed that the goals of the blueprint, and the government’s progress in implementing it, are top of mind in the private sector .
There are signals suggesting that red tape is particularly challenging for exporters. USAID (2011) indicated that there is compelling evidence suggesting relevant challenges in regulatory quality that impede investment, particularly affecting export performance. The evidence included a correlation between Tanzania’s WGI Regulatory Quality Index and the proportion of exports as percentage of GDP (USAID, 2011), and studies indicating that bureaucratic burden related to regulation was higher for exporter firms than for non-exporters. Both number of inspections and days spend dealing with regulatory issues are higher for exporter firms (IFC, 2004). On the top of that, an evaluation of the SEZ and EPZ programs in Tanzania, pointed that firms reported bureaucratic problems red tape and lack of clarity in policies as main constraints. The study shows that firms located in SEZs, are overburdened with red tape and bureaucratic procedures, adding costs, and reducing their competitiveness (Kinyondo et al., 2016).
2.5.5. Trade policy
After the liberalization of the economy in the mid- 1980s, Tanzania’s tr ade openness increased sharply, reaching a peak in 2011. Since then, it has fallen persistently and ranks as one of the lowest among Tanzania’s peers. Imports and exports reached 56% of GDP in 2011, mostly driven by imports (34% of GDP). Likewise, the persistent decline recorded since has been mostly driven by imports rather than in exports. As a result, by 2021 exports account for 14% of GDP and imports for another 17%, placing Tanzania behind most peers in terms of trade openness (Figure 108).
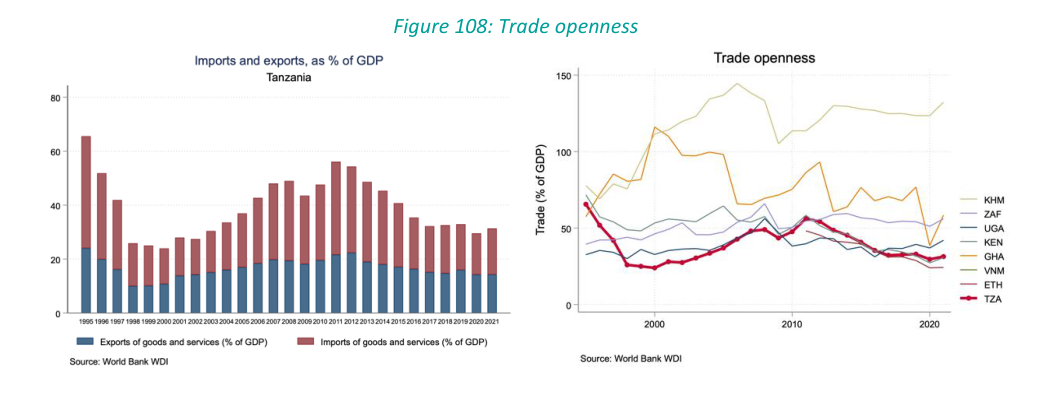
104 See the following link . 105 See the following link . 106 See the following link .
Report Growth Diagnostics and Competitiveness Study of the Manufacturing Sector in Tanzania 89
Tanzania’s imports of goods and services are among the lowest in the sample and one of the lowest in the world, which limits any opportunities for further import substitution industrialization (ISI) and localization. Domestic imports have fluctuated a lot from the peak of more than 40% of GDP in 1995, to the historic lows of 13.1% in 2000, and back to 34% in 2011 ( Figure 109 ) . From 2011 onwards, imports have been declining consistently, down to half of their peak values and representing just 17% of GDP in 2021. In 2020, out of 12.2 billion USD worth of imports, more than 10% were fuels petroleum oils and gases, 10% by machinery, and 14% by vehicles and electronics combined. These are not easily substitutable.
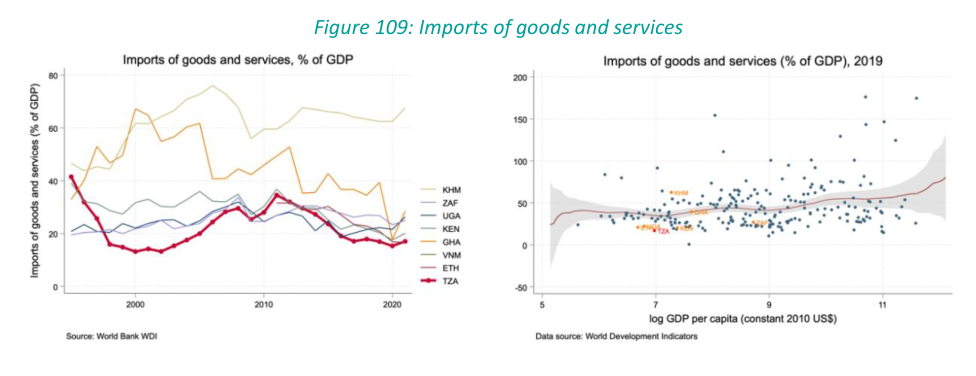
The government of Tanzania signaled a shift in its growth strategy – away from ISI and towards export-led – in the 2000s through the creation of two key institutional structures. In 2002, Tanzania set up Export Processing Zones (EPZs) aiming to promote and facilitate exportoriented investments. Four years later, Tanzania established the Special Economic Zones (SEZs) to help implement the Mini-Tiger Plan 2020 – aimed at increasing level of exports from USD 1 billion to USD 20 billion by 2025 – and fast-tracking economic growth. In the same year, the Export Processing Zones Authority (EPZA) was created, in charge of managing both the EPZs and SEZs.
While the eligibility criteria to obtain a license for either of the zones is relatively accessible, the main benefits include both fiscal and non-fiscal incentives for the firms. Eligibility criteria for firms wishing to obtain an EPZ license include (i) being a new investment, (ii) at least 80% of goods produced should be exported, and (iii) minimum annual turnover of USD 500.000 for foreign investors and USD 100.000 for local investors. EPZs can take the form of either industrial parks or single factory units. For SEZs the criteria include (i) being a new investment, (ii) a minimum capital of USD 100,000 for local investors and 500,000 for foreign investors, and (iii) the investment project must be located within the designated SEZ area. Obtaining a license in either an SEZ or an EPZs unlocks a 10-year corporate and withholding tax holiday as well as duty, wharfage (fees charged by ports authorities for goods staying in yards before cleared), and VAT exemptions on raw materials and utilities. Non-fiscal benefits include on-site customs documentation and inspection, the ability to acquire visas for key technical staff at the point of entry, securing unconditional transferability of profits, dividends and loyalties, and access to one-stop-service center by EPZA for set-up facilitation and aftercare.
Despite multiple designated SEZs/EPZs spaces, most of them have not been operationalized, and single factory units have proliferated instead. There are currently 14 designated EPZ/SEZ industrial parks, 10 of which are in development, and 75 stand-alone EPZ factories, and the government expects to complete most SEZs under development by 2025 (Third National Development Plan). However, the existing parks seem to be underutilized. According to the most recent available data from 2019, 169 firms are registered with SEZ/EPZ licenses but only 100 are operational (Andreoni et al., 2022). Out of those, over 70% have standalone licenses indicating that they do not operate within industrial parks (Andreoni et al., 2022).
Report Growth Diagnostics and Competitiveness Study of the Manufacturing Sector in Tanzania 90
This export growth strategy has not delivered the desired outcomes, due to inefficiencies in the policy design and implementation of the zones. While the government has set up the legal framework to promote manufactured exports, in practice it has not provided the investment needed to overcome the main constraints that companies are facing: adequate provision of electricity, water, and serviced land. Most exporting firms obtain licenses for single factory units failing to generate the dynamism of economies of agglomeration that can lead to declining production costs, technological transfer, and increasing labor productivity, as SEZs have mostly been used to reap tax benefits for low-complexity companies that for the most part assemble semi-finished goods. The regulatory burden associated with operating within SEZs/EPZs is also often seen as more burdensome than regulatory requirements outside the zones, as firms have found inefficient customs regulation one of the main obstacles for competitiveness. Moreover, there seems to be anecdotal evidence suggesting these zones are not well located, as firms on the ground complained of not having access to cheap low-skill and semi-skilled labor. Indeed, wages in the zones are reported to be higher than for comparable workers outside the zones, which suggests that labor regulations are differentially more expensive.
Tanzania adopted a Common External Tariff (CET) in 2005 through its membership in EAC, has had a free trade zone with 16 Southern African Development Community (SADC) countries 107 and the US (through AGOA), and was previously a part of the Common Market for Eastern and Southern Africa (COMESA) 108 . The country is a regular WTO member from 1995 and enjoys duty-free access to the United States under the African Growth and Opportunities Act (AGOA) 109 and to the European Union under the and the Everything But Arms (EBA) program. More recently, in 2021, Tanzania became one of the 41 African Union member countries to ratify 110 and trade 111 under the African Continental Free Trade Area (AfCFTA), which requires members to remove tariffs from 90 percent of goods, boosting trade across the continent. However, it has been reported that “Tanzanian stakeholders are not yet fully aware of the challenges created by AfCFTA in terms of competitiveness, no r understand how it will affect them” 112 , so the implementation of the AfCFTA is still underway.
While the bulk of the total exports goes to Asia, free trade zones and common tariff agreements have led to increased trade facilitation within the SSA and the African continent more broadly. Goods in agriculture and minerals and services represent the highest shares of the total exports, with the main trading partners including counties in Asia and Africa that absorb 80% of all exports. In 2019, India, UAE, China, Vietnam, Kenya, Uganda, and Rwanda accounted for almost 60% of total exports 113 . At the same time, Sub-Saharan Africa and South- East Asia were the major export destinations for Tanzania’s merchandise exports ( Figure 110). While up until 2000, the shares of exports going to each were comparable, the last two decades saw an unprecedented shift in trade flows towards the African countries: from just above 10% of all merchandized exports in 2001 to more than 40% in 2018. However, within EAC, trade remains low, with Tanzania only sourcing 4% of imports from within EAC and exports accounting for 10.5% in 2015 114 .
107 See the following link . 108 See the following link . 109 See the following link . 110 See the following link . 111 See the following link . 112 See the following link . 113 Atlas of Economic Complexity visualization from: link . 114 International Bank for Reconstruction and Development/The World Bank, “Tanzania DTIS 2017.” Report Growth Diagnostics and Competitiveness Study of the Manufacturing Sector in Tanzania 91
Figure 110: Merchandise exports by region
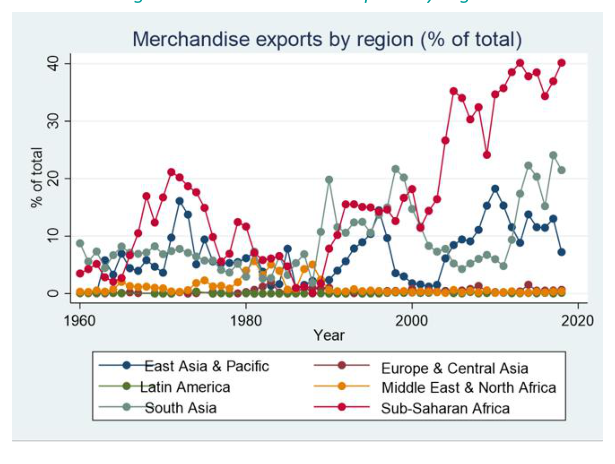
Source: World Bank WDI Tanzania used to be the most trade-restricted country in the world (2009) and – despite the multiple trade agreements signed – still ranks relatively low among peers in terms of both tariff and non-tariff barriers. While the World Bank’s Overall Trade Restrictiveness Index hasn’t been updated since 2009 (Figure 111), the more recent estimates of non-tariff and overall barriers to trade point to improvements (Figure 112). While Tanzania still ranks as one of the most restricted countries among its peers, trade barriers and non-tariff barriers are on par with what is expected for its income level. However, there are specific barriers, often mentioned by the companies that remain in place today. Explicit barriers to exporting raw agricultural materials to promote domestic processing are seen as constraining the domestic supply, since they reduce the price that farmers earn for their crops and depresses supply. Anecdotal evidence from firms in the Textiles and Tobacco sectors supports the claim that domestic prices for agricultural inputs are lower than they could fetch internationally, decreasing the incentives of producers to supply to the local markets. That, in turn, depresses domestic supply for the whole value chain, and does not result in increased industrial production as envisioned.
Figure 111: Trade restrictiveness index and GDP per capita
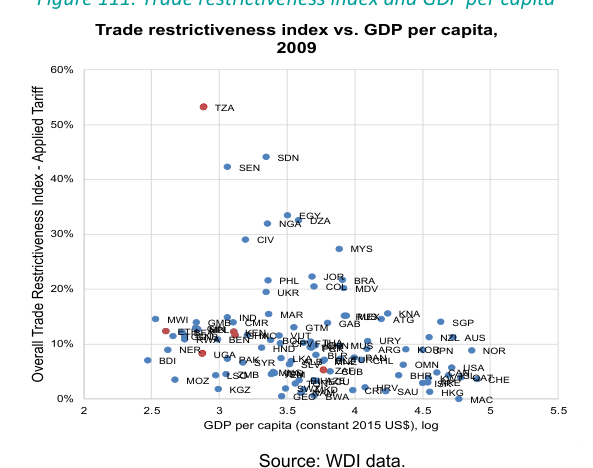
Source: WDI data.
Report Growth Diagnostics and Competitiveness Study of the Manufacturing Sector in Tanzania 92
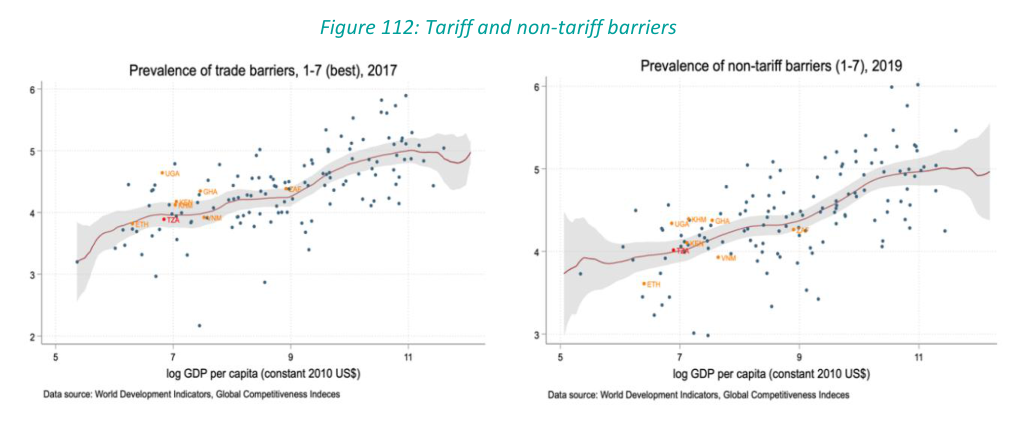
Tanzania is a clear outlier in terms of the burden of regulations associated with trade. According to the Trade Openness Index, by 2018 Tanzania ranked the third lowest in the world (only better than Venezuela and The Democratic Republic of the Congo), far away from peers and from the level one would expect given its level of income (Figure 113). The index is built based on the average number of procedures and time taken to export and import goods using data from the World Bank’s Doing Business dataset and is meant to be an indicator of how burdensome the process of trade from a regulatory standpoint is. According to the border and documentary compliance (Figure 114), Tanzania’s ranking seems to be driven mostly by difficulties associated with the process of exporting, which ranks highest among peers at twice the estimated cost of the second-to-last, Mozambique. It is reported that the degree of trade regulations holds back agents in the economy and “limits their access to new and improved inputs, which prevent smallholders from competing on a le vel playing field with larger firms” 115 .
Figure 113: Trade openness index
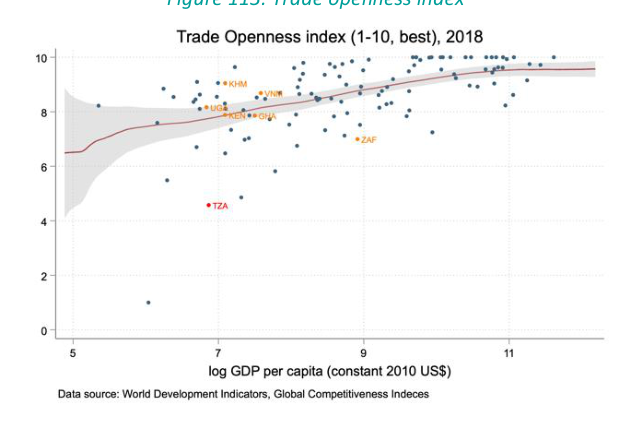
Report Growth Diagnostics and Competitiveness Study of the Manufacturing Sector in Tanzania 93
Figure 114: Compliance costs
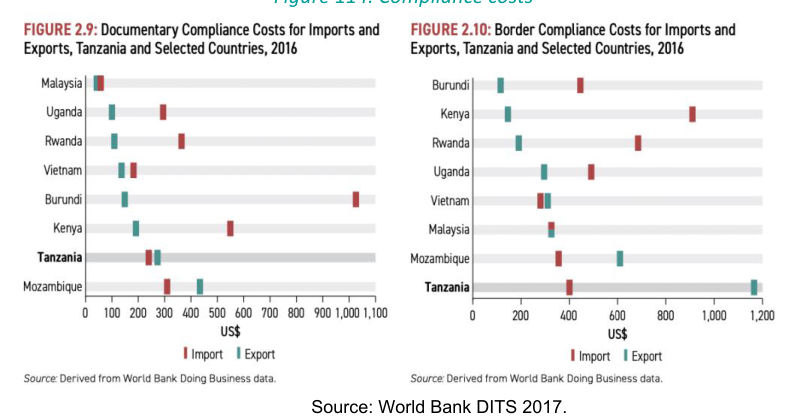
Source: World Bank DITS 2017.
With the CET being the primary tariff regime for all EAC members, average tariff rates have been relatively stable since 2005 for both the broader economy and the manufacturing sector. Within EAC, Tanzania is the country with one of the biggest shares of imports subject to the CET (91% and 97% of imports, depending on the inclusion of tariff-free intra-EAC trade), second only to Kenya 116 . Thus, on average, the tariffs seem to have been stable across all products, including manufacturing and do not exceed 10%, down from more than 20% at the end of the 20 th century (Figure 115 ). While most Tanzania’s tariff lines are following CET, it is reported to exhibit tariff deviation for a “sensitive products” list, which mostly includes agricultural products and some manufacturing goods, like cement 117 .
Figure 115: Average tariff rates
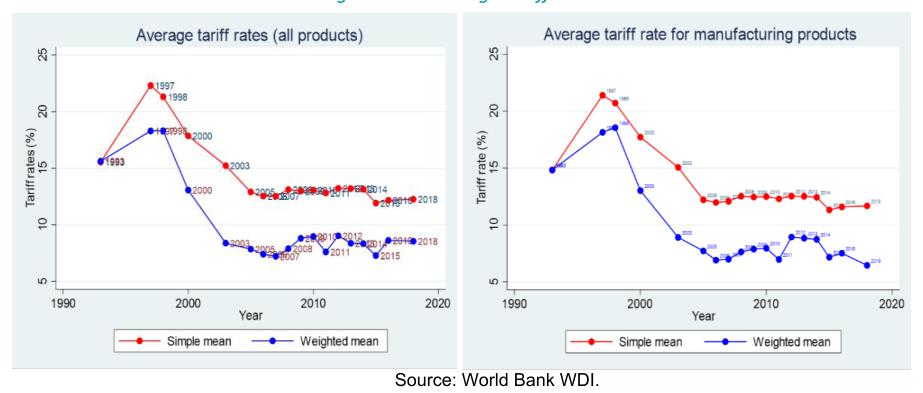
Source: World Bank WDI.
However, within the EAC, Tanzania is reported to be one of the counties that most uses individual Stays of Application to unilaterally deviate from CET to increase tariffs and offer protection for individual products and entire domestic industries. While country-level deviations are increasingly common within the EAC, Rauschendorfer and Twum (2020) find that not all the countries within the Community behave similarly. Kenya, Tanzania, and Uganda predominantly use country-level deviations (individual Stays of Application) to increase trade protection and tend to target the same broad classes of products but different industries for trade protection. Based on the number of individual Stays of Application, Tanzania mostly issues protection for the agricultural sector and related industries. In the manufacturing sector, the Report Growth Diagnostics and Competitiveness Study of the Manufacturing Sector in Tanzania 94
protection falls on prepared foodstuffs, wood pulp and paper, and base metals ( Figure 116 ) 118 . Thus, even though average tariffs do not seem to be high or increasing, sectors where Tanzania uses the most discretionary protection heavily overlap with the manufacturing sub-sectors that bring most of the value added, which are food and beverage and metals-related industries.
Figure 116: Stays of application
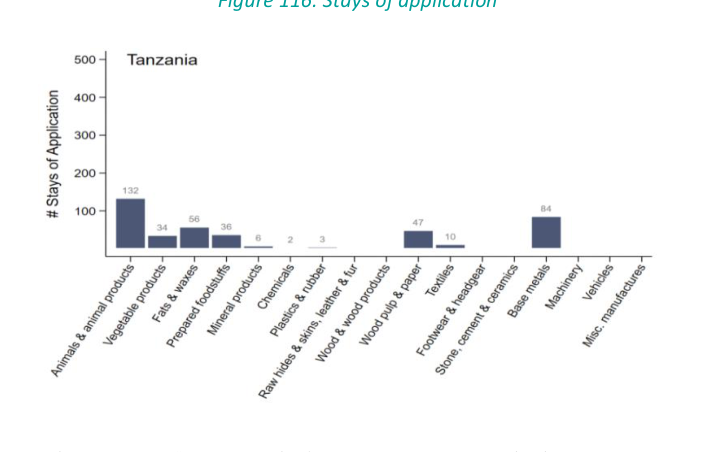
Source: Rauschendorfer and Twum, “Unmaking of a Customs Union: Regional (Dis)Integration in the East African Community.” Tanzania also seems to target intermediate products for trade protection, increasing import tariffs for them more often than for capital or consumer goods, which might harm downstream industries and create an anti-export bias. Even though in some cases tariff reductions on the country level are used to facilitate access to inputs 119 (65.8% out of 76 unilateral reductions of tariffs are implemented for the intermediate goods), in absolute terms it is nowhere close the number of tariffs increases (in 53% of the 410 cases) used to protect intermediate inputs. While increased tariffs on intermediate inputs have a significant impact on production costs for local, reduce competitiveness of the downstream industries, and ultimately hinder the incentives for domestic production 120 , the private sector in the EAC still struggles with high inputs costs, and would “benefit from lower tariffs on intermediate inputs” 121 .
Indeed, average tariff rates in the manufacturing sector in Tanzania are above the international trend, which is driven by CET tariff setting, tariff exceptions, and the fact that around 40% of tariffs are above international peaks. While CET tariff setting scheme is based upon three bands – 0% on raw materials and capital goods, 10% on intermediate goods, and 25% on final goods, with more than 98% of goods falling within these three bands – the EAC classification might not fully match international tariff schemes, which results in more than 40% of the tariff lines in Tanzania being above international peaks ( Figure 117 ) . This, together with unilateral deviations from CET through the individual Stays of Application and the “sensitive products” maximum tariffs which go up to 75% for vegetable products and 100% for footwear 122 , lead to Tanzania ranking above the international trend when assessing average tariffs.
Report Growth Diagnostics and Competitiveness Study of the Manufacturing Sector in Tanzania 95
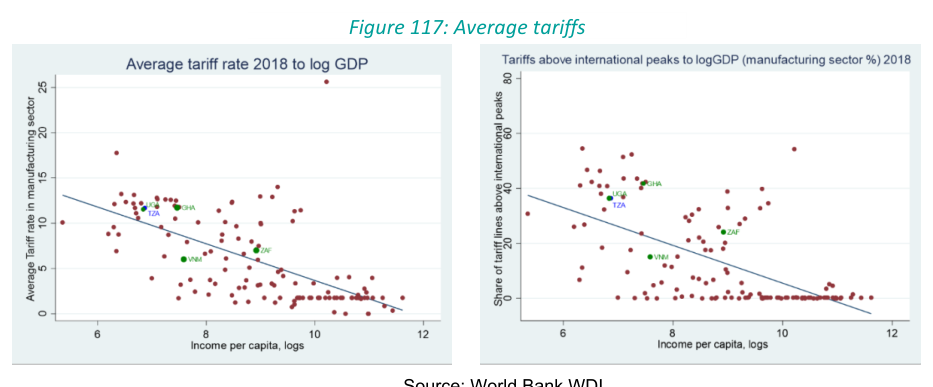
Source: World Bank WDI.
In Tanzania’s manufacturing sector, a higher degree of protection seems to be associated with a larger share in value added and a lower share of net exports (Figure 118). I ndustries with the highest protection – as measured by the average of the maximum tariffs for products in each respective ISIC category – like food and beverages, non-metallic mineral products, and wearing apparel, thrive in the domestic market and represent a large share of value added, but struggle when it comes to competing in international markets and exporting their products. This is suggestive evidence indicating the presence of an antiexport bias, which is defined “as the excess of domestic prices over effective export prices relative to the local currency equivalent of the world price” 123 .
Figure 118: Average maximum tariffs: Value-added vs. exports at the industry level
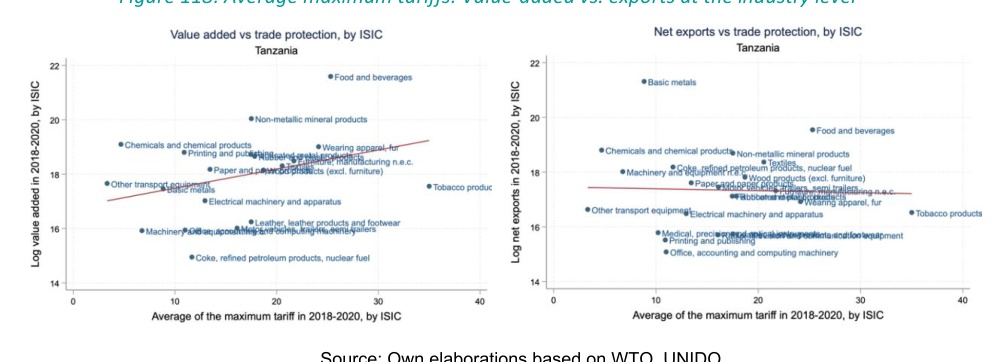
Source: Own elaborations based on WTO, UNIDO.
Sectors that tend to be intensive in the use of electricity and finance seem to add the most domestic value while being the most protected via local trade policies. The upper-right quadrant of Figure 119 outlines the space with the domestic manufacturing industries that are the most protected and bring the most value added. While 83% of the industries represented in that quadrangle are high or moderate in their use of electricity, the most capital and finance-intensive sub-sectors (measured by gross capital formation per worker, which determines the bubble size) tend to gravitate towards a high tariffs-high value-added equilibrium.
123 Tyler, “The Anti – Export Bias in Commercial Policies and Export Performance.” Report Growth Diagnostics and Competitiveness Study of the Manufacturing Sector in Tanzania 96
Figure 119: Value added vs. trade protection
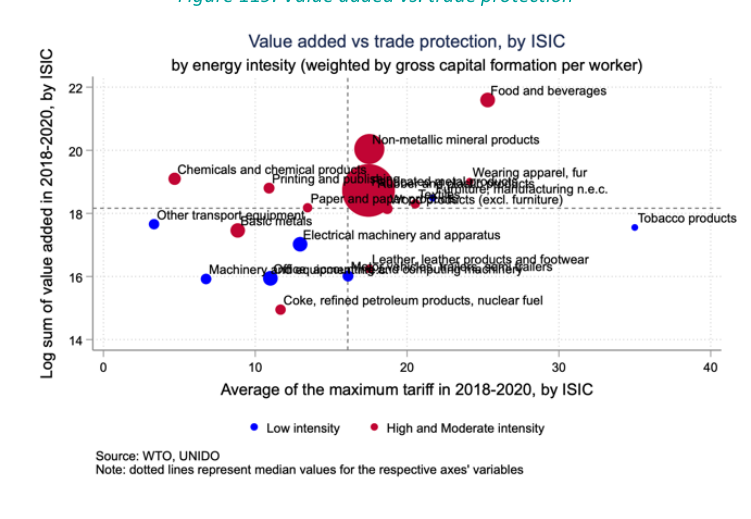
At the same time, sectors that represent large shares of value added and are intensive in electricity tend to be less labor-intensive and more trade protected. As documented by Diao et al. (2021), larger firms in Tanzania that exhibit superior productivity do not expand employment, and this poor employment performance is related to the use of capital-intensive techniques associated with global trends in technology. Figure 120, while corroborating the low labor intensity of the most productive (measured by total value added, which determines the bubble size) sectors, adds another dimension also, shows that these sectors are also intensive in the use of factors that are constrained (electricity) and highly protected (concentrated in the lower-right quadrangle).
Figure 120: Labor intensity vs. trade protection
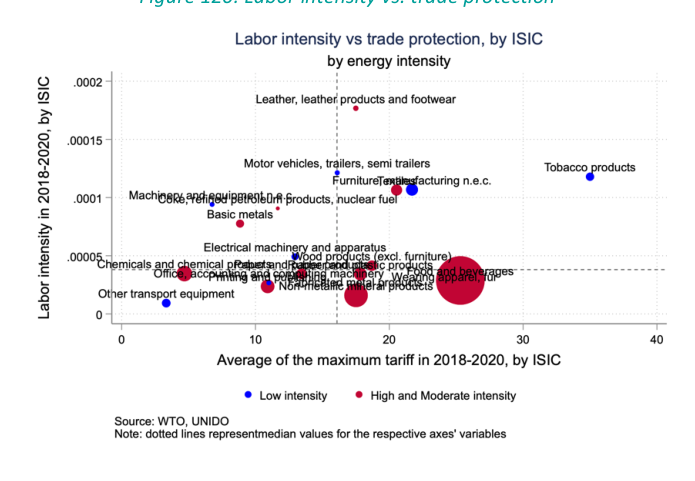
Note: Bubbles are weighted by total value added.
Report Growth Diagnostics and Competitiveness Study of the Manufacturing Sector in Tanzania 97
2.5.6. Other microeconomic failures
Crime does not represent a major issue for the manufacturing sector in Tanzania. The proportion of firms indicating crime, theft and disorder as main obstacle is very low in Tanzania – just 1% of the firms surveyed in the manufacturing sector (Figure 121, Panel A) and 2% overall. Moreover, crime is one of the least problematic factors for doing business according to the WEF Executive Opinion Survey (indicated by just 2.8% of the respondents) 124 . This proportion is intermediate compared to peers (Figure 121, Panel C). The percent of firms experiencing losses due to theft and vandalism was high in Tanzania in 2006 – reaching a 32% of the manufacturing firms – but decreased to 18% in 2013 (Figure 121, Panel B). Security costs (as share of annual sales) are low in Tanzania compared to peers and the international trend (Figure 121, Panel C).
Figure 121: Percentage of firms identifying crime as main obstacle (manufacturing sector)
A.- Crime, theft and disorder as B.-Percent of firms experiencing losses due to theft and vandalism main obstacle
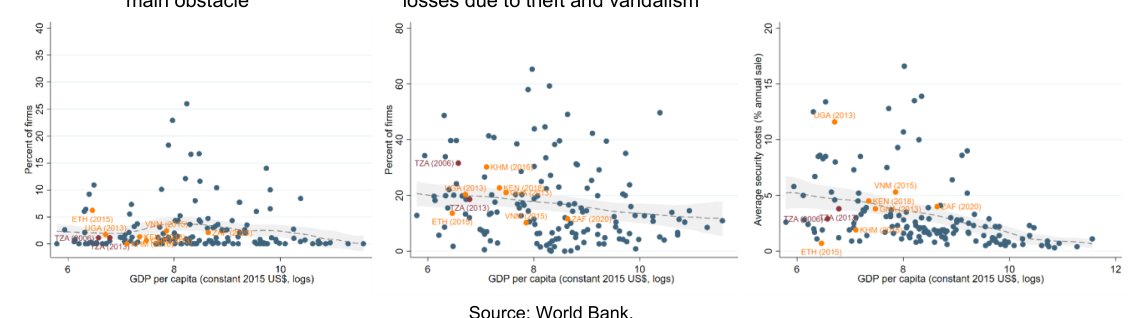
Source: World Bank.
The proportion of firms indicating that corruption is their main obstacle is very low in the manufacturing sector in Tanzania, well below peers and the international trend. In 2013, 0.5% of the manufacture firms selected corruption as the main barrier for growth, well below peers and the expected value given the income of the country. That year, 0% of the firms in the sector selected courts as the main obstacle (Figure 122). Despite corruption being the fifth most problematic factor for doing business in the country 125 , compared to peers’ corruption is rated as less of a problem in Tanzania (Figure 123), well below African and international peers.
Figure 122: Corruption and court system as main obstacles, manufacturing sector
Corruption as main obstacle Court system as main constraint
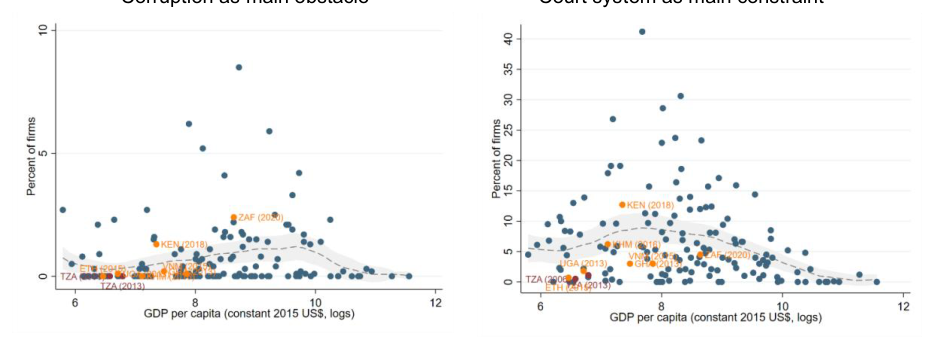
Report Growth Diagnostics and Competitiveness Study of the Manufacturing Sector in Tanzania 98 C.-Average security costs (% annual sale)
Figure 123: Most problematic factors for doing business, Tanzania and peers
Corruption Inefficient government bureaucracy Crime and theft
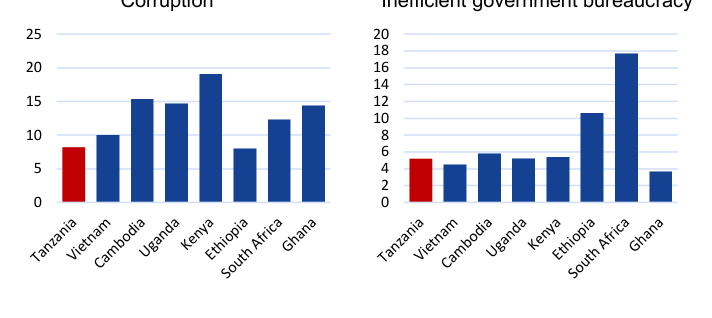
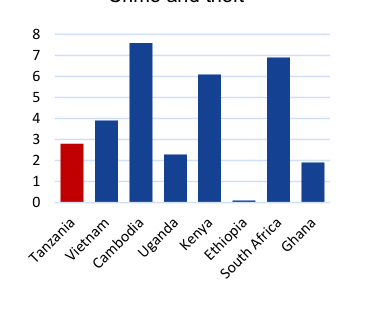
Source: Global Competitiveness Index 2017-2018 .
Overall, Tanzania struggles with various types of microeconomic risks and inefficiencies. Despite its low level of income, formal wage levels are not a competitive advantage to attract international investment in labor-intensive manufacturing, and the informal economy dominates employment. The taxation system is stuck in an equilibrium with relatively higher tax rates, a plethora of exemptions, and an overall low tax take. Moreover, taxation is relatively higher on labor and lower on capital, skewing returns away from the country’s relative labor abundance and capital scarcity. Formal ownership of land is a problem, which both directly reduces investment as well as indirectly through limiting access to finance. Therefore, measures aimed at improving the business environment and benefiting both domestically and exporter firms could enhance competition and p romote diversification. Tanzania’s Blueprint for Regulatory Reforms outlined most of these measures – a few of them aimed particularly at the manufacturing sector – but during our field trips we realized that this agenda has not advanced significantly.
Des pite these challenges, there isn’t clear evidence that these are the most binding constraints to investment and growth in the manufacturing sector. Periods of improvement and deterioration in these challenges are not accompanied by a noticeable response in investment, which would be the case if they were binding. Most tellingly, firms themselves do not seem to consider them as first order constraints in the most recent survey data and global indices available, though they were mentioned frequently in our own interviews.
Yet these constraints, particularly trade policy, land access, and red tape do seem particularly relevant for international investors and exporters. Land acquisition is particularly complicated for foreign investors. The current legislation does not allow foreigners to own a land, restricting their access to a derivative right through the Tanzania Investment Center. This restriction was mentioned by some of the companies we interviewed in Tanzania. On the top of that, there is some evidence pointing that one important constraint affecting the implementation of EPZ and SEZ schemes is the non-availability of serviced land and the compensations required for its acquisition. This would suggest that land access could also be a potential limitation for the development of the manufacturing sector, particularly foreign and exporting firms. In addition, we showed evidence pointing that regulatory burden would be hindering companies within EPZ and SEZ – to the degree that those actors are the most relevant for new investment on the margin, the relevance of these constraints would increase.
Report Growth Diagnostics and Competitiveness Study of the Manufacturing Sector in Tanzania 99
2.6. Market Failures
As reported in Section 1, Tanzania’s manufacturing sector is relatively small and concentrated in unsophisticated industries that are unlikely to fuel future growth, so developing new engines of growth in the sector is essential. This is a process of selfdiscovery, where places discover economic activities they can produce in a competitive way, and there is coordinated investment across the public and private sectors so that the new activities successfully emerge and grow.
Diversification into new manufacturing activities is challenging and is subject to market failures. Hausmann and Rodrik (2002) identified information failures and coordination failures as potential constraints to this process. Information failures are related to the costs to discover whether a new economic activity is profitable. A pioneer must invest to discover if a certain industry can be profitable in a place, but they can only capture a fraction of the social value of the knowledge generated because subsequent entrants can free ride on that investment in discovery. Therefore, pioneers tend to under-invest in discovering new sectors with respect to what would be socially optimal. Coordination failures refer to situations where to make a new industry feasible there must be simultaneous investments by a range of private sector firms, as well as the public sector – but the market does not naturally provide the necessary information and coordination for that to happen. The existence of this market failure prevents diversification because each firm cannot invest without having the other firms investing at the same time, and the state does not have the appropriate knowledge of the set of public goods needed nor the ability to effectively deliver them across different levels of public institutions. These market failures can prevent new manufacturing sectors from emerging.
Tanzania has thus far not managed to diversify into a sophisticated set of manufacturing activities for export, though is not necessarily suffering from coordination failures. Tanzania’s E conomic Complexity Index (ECI) is low and falling behind peer countries. Yet its Complexity Outlook Index (COI) suggests that there are nearby (from an economic standpoint) opportunities for export diversification that, if successfully developed, would spur the accumulation of know-how, diversification, and economic growth. These activities rely on productive capabilities that largely exist already in the country, and therefore do not require coordinated simultaneous investment into a range of new activities.
Moreover, Tanzania has demonstrated its ability to diversify into new export activities that require similar capabilities to those already in place, which suggests that existing institutions are able to coordinate export diversification. To evaluate whether Tanzania has been able to diversify into nearby opportunities we estimated the capacity of the proximity measure to predict appearances of products (RCA>1) over the period 2011 to 2019. We then analyzed if the country has been doing better or worse than the average country in terms of leveraging its capabilities to move into adjacent new activities.
We estimate the probability of developing a product with RCA greater or equal to one (the country has a comparative advantage in the export of the product) for the period between 2011 and 2019 126 , controlling for density. The estimation is the following:

The jump variable indicates whether a product i in country j went from an RCA lower to 0.25 to equal or greater than 1 in the period analyzed. We also considered a second definition of jump , in which the variable is 1 if the product i in the country j went from an RCA below 0.25 to an RCA over 1 for two consecutive periods. We are interested in the differential probability of jumping of Report Growth Diagnostics and Competitiveness Study of the Manufacturing Sector in Tanzania 100
Tanzania – and the peer countries – compared to an average country in the sample. To obtain this difference, we use the adjusted prediction of the model (1), which shows probability of jumping when specifying specific valued for the variables of interest. In this exercise, we use the average RCA of the products in the sample, and two different measures for density, considering the median value of density in the sample, and the top decile. By doing so, it allows us to compare whether Tanzania – and the peer countries – jumped more or less than the average country to products that are closer in terms of capabilities.
The results of the analysis show that Tanzania jumped relatively less to average distance products, but more than average to nearby products. According to the Panel A of Figure 124, the predicted value of jumping is lower in Tanzania (less 1%) compared to the average country (2%) when considering the value of density at median. In other words, the chance of any new product at average distance being successfully produced (from RCA below 0.25 to RCA over 1) by Tanzania is less than 1 percent, while an average country in the sample has a 2 percent chance. Nevertheless, when considering only nearby products (density at top decile) Tanzania jumped more than the average country. The predicted value of jumping in Tanzania is 12%, while 3% in an average country (Figure 124, Panel B). Compared to peers, Tanzania is the fourth country with higher ability of jumping to nearby products, behind Uganda, Ethiopia, and Cambodia.
Figure 124: Adjusted prediction of jumping, average RCA, and density at median and top decile
A. Density at median
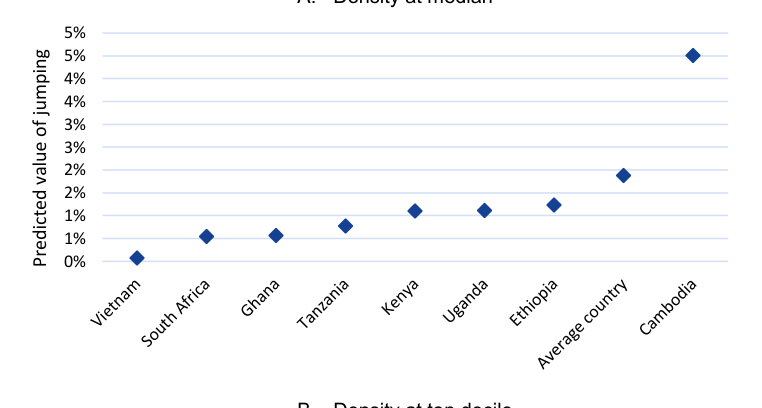
B. Density at top decile
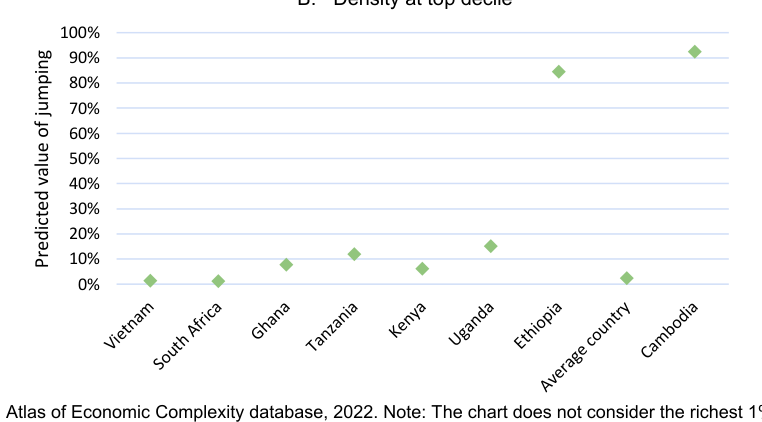
Source: Atlas of Economic Complexity database, 2022. Note: The chart does not consider the richest 1% of the countries in the sample.
Report Growth Diagnostics and Competitiveness Study of the Manufacturing Sector in Tanzania 101
Despite the ability to jump to nearby products of higher sophistication, the economic complexity of the manufacturing sector in general has been worsening. Figure 125 shows the Economic Complexity Index (ECI) for the manufacturing sector in 2011 and 2019. In almost all the peer countries the ECI of 2019 is higher than 2011, which the exception of Tanzania and Ghana. Despite this drop in the complexity of Tanzania’s manufacturing sector, we observe that products the country jumped to over the last decade have a higher ECI in 2019, indicating that those are complexity-improving jumps. Thus, Tanzania has been able to jump to nearby products, and those products on the margin improve their economic complexity, yet their impact has been too small to increase overall complexity. Increasing shares of unsophisticated exports overwhelm the entry of new products and reduce the overall growth potential of Tanzania’s exports.
Figure 125: ECI manufacturing products, 2011, 2019 and jumping products
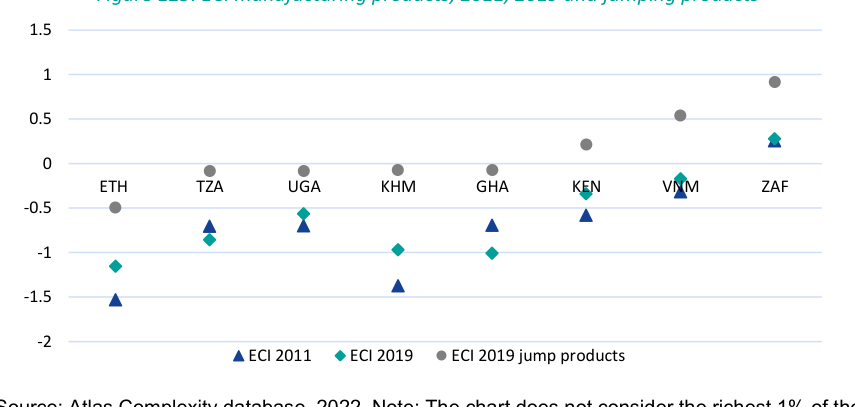
Source: Atlas Complexity database, 2022. Note: The chart does not consider the richest 1% of the countries in the sample.
Thirty five new products were added to Tanzania ’s export basket between 2011 and 2019, accounting for USD 134 million dollars in exports, a scale that is insufficient to increase overall complexity. Tanzania developed 35 ‘new’ products in the last decade 127 , positioned as the third country in the peer group in terms of simple count of new products (Table 3). Yet the combined value of those new exports is relatively low. Average export value per new product is among the lowest in its peer group, and the contribution of new exports to total exports is just 5.1%, lower than most peers. New and more sophisticated export sectors have emerged but have failed to expand enough to change the declining trends in overall complexity.
127 Products are labeled as “new” if they were not exported with RCA higher than 0 .25 in 2011 and displayed RCA higher than 1 by 2019.
Report Growth Diagnostics and Competitiveness Study of the Manufacturing Sector in Tanzania 102
Table 3: Number of new products between 2011 and 2019
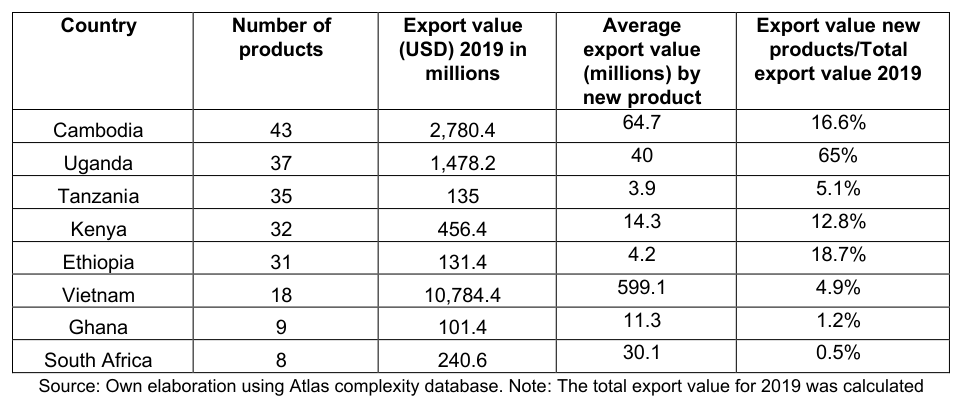
Source: Own elaboration using Atlas complexity database. Note: The total export value for 2019 was calculated considering those products with RCA>1.
According to the WPO patents data, Tanzania has the lowest patents per capita, well below peers and other countries with similar income per capita. Figure 126 shows that there is a positive correlation between the number of patents and the income per capita across countries. Tanzania’s patents per capita is the lowest in the sample, very below peer s and countries with similar income. Besides, according to the Global Competitiveness Index, the Innovation pillar is the third lowest (3.2 out of 7), mainly due to the low score in the sub-pillar related to the development of patents (with a score of 0). Accordingly, the Global Innovation Index (GII) for 2020 indicates that tertiary enrollment, quality of universities, patent families, and computer software spending remain relative weaknesses for the country 128 . These low ratings in terms of Science, Technology and Innovation are also consistent with the indicators presented in the Human Capital Section of this paper, such as low tertiary enrollment. Given Tanzania’s level of development, the bulk of manufacturing growth will not come from inventions on the global technological frontier (Nordhaus 1969). Moreover, given the country’s high COI but low ECI, there are apparently first – order constraints preventing manufacturing growth even in simple, nearby sectors which do not require much by way of technology and innovation. Therefore, it is difficult to argue that the country’s low level of manufacturing growth is caused by its weaknesses to innovate.
These results suggest that Tanzania does need to diversify into new, more sophisticated export activities that can scale up and bring higher wages and economic growth, but market failures are not what is hindering this process . Tanzania does not seem particularly capable at patenting new inventions nor making long jumps in the product space, but given the country’s level of income and COI, they do not need to grow. There are sufficient activities nearby – from a productive capacity standpoint – to fuel diversification and growth.
128 For more information see the following link .
Report Growth Diagnostics and Competitiveness Study of the Manufacturing Sector in Tanzania 103
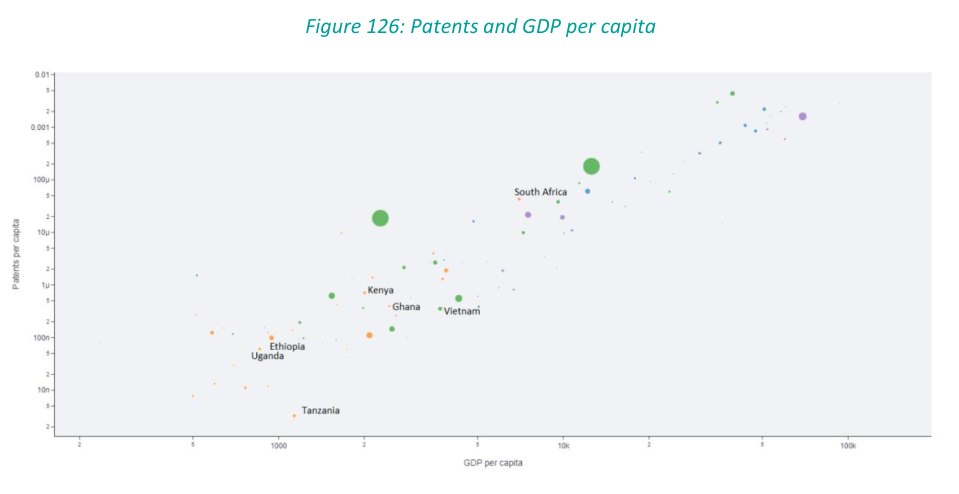
Source: WIPO data. Note: Panel data covers the period 2010-19.
2.7. Sheltered Manufacturing Syndrome
The structure of Tanzania’s manufacturing sector today has been shaped by decades of inward-oriented policies. Import Substitution Industrialization (ISI) policies in Tanzania started right after independence in 1961, within the context of the broader Ujamaa development plan (“extended fraternity” in Swahili), and prolonged well into the mid -1980s. As in many other countries, the efforts were aimed at promoting self-reliance through a combination of tax incentives, high barriers to imports by means of tariffs and quotas, tax incentives, and subsidies. Despite Tanzania’s efforts to shift away from ISI and move towar ds a more open, market-based economy from 1986 onwards, we have uncovered significant evidence suggesting that ISI remnants continue to be at the core of Tanzania’s industrial policy and shape the incentives for the manufacturing sector today. The subscription to Common External Tariff (CET) and free trade agreements such as SADC, AGOA, and AfCFTA coexist with an environment that imposes a high regulatory burden on trading industries and restricts trade by means of tariff and non-tariff barriers, eased by filing numerous exceptions to those treaties that offer protection for individual products and entire domestic industries.
Tanzania has managed to develop an inward-oriented manufacturing sector that has made a significant contribution to employment and value added but remains uncompetitive from an export standpoint. As reported above, higher degrees of protection (measured by the average of the maximum tariffs for products within each ISIC category) for sub-sectors within manufacturing are associated with higher contributions to value added and lower contributions to exports. The problem is not the efficiency of these policies to deliver growth in the past, but rather that a) the space for further manufacturing growth through ISI is small and insufficient to meet the stated goals in terms of structural transformation and share of manufacturing in GDP, and b) growth has been concentrated among a small number of highly productive capital-intensive firms that do not expand employment opportunities.
Protective policies are strongly biased towards energy and capital-intensive sectors and display a clear anti-export bias. Sectors that enjoy higher levels of protection and represent large shares of value added tend to be more capital intensive and display a moderate to high intensity in the use of energy. That in turn helps in explaining the findings of Rodrik et al. (2021), who documented that the most productive firms in Tanzania are capital-intensive but do not expand employment, whereas the least productive firms within manufacturing did manage to create employment at low levels of wages.
Report Growth Diagnostics and Competitiveness Study of the Manufacturing Sector in Tanzania 104
The energy and capital-intensive bias of Tan zania’s manufacturing is particularly relevant because these are two areas that display significant symptoms of binding constraints. Electricity is the most relevant binding constraint identified in this report. Power outages and derived economic losses are high, as is the share of firms that identify electricity as the important factor hindering further investment and growth. Firms plan their production schedules, and even decide on plant locations, based on power reliability. In terms of access to finance in Tanzania, there are many symptoms suggesting that is an additional challenge, in particular the country’s high real interest rates and firm s’ complaints in enterprise surveys. Yet large domestic business groups and foreign firms – which can fund investments by using retained earnings or tapping into foreign savings – are not expanding their investment in manufacturing either. Most tellingly, the periods of significant increases in domestic credit followed by restrictions to domestic credit did not have a corresponding impact on the size of the manufacturing sector, suggesting that finance, despite being a challenging input to source, is not the most binding constraint.
Aside from these areas, there are also challenges to appropriability of returns coming from government failures, particularly microeconomic risks from taxes, regulatory inefficiencies, and land availability . The signals for these constraints are not as strong as for electricity, but they seem particularly binding for international for exporters and appear to further orient production towards inwardly focused capitaland electricity-intensive sectors, in a laborabundant country with expensive finance and electricity shortages.
Efforts to promote export competitiveness in the manufacturing sector by means of Export Processing Zones (EPZ) and Special Economic Zones (SEZ) have failed to address the underlying constraints and resulted in significant corporate and withholding tax holidays for protected firms. EPZ and SEZ were established with the goal of promoting investment and exports and offered various benefits that included 10-year corporate and withholding tax holiday, VAT exemptions on raw materials and utilities, on-site customs inspection, eased immigration processes for high-skill foreign workers, unconditional transferability of profits, and access to onestop-service center by EPZA. The most important constraints firms were facing – access to reliable electricity, serviced land, and relief from excessive regulatory burdens – have not been addressed by these zones, and according to various sources, even deteriorated in the case of red tape. In time, many firms have filed and become SEZs as stand-alone units, allowing them to reap tax benefits without contributing to promoting economies of agglomeration or exports.
Failure to address the most binding constraints has in turn created a rationale for upholding protection, which in turn reinforces the capital and energy-intensiveness bias of the manufacturing sector. While protective trade policies have enabled firms to thrive in the domestic market, the persistence of the constraints identified renders them less competitive in the international arena. That persistence requires continuous protection for these firms to survive in the face of otherwise cheaper imports, and for government to maintain current domestic value added and employment in manufacturing. As a result, Tanzanian manufacturing remains uncompetitive in global markets, unable to tap into international demand to further its growth, yet unable to move away from protection. These trends have led to a stable but inefficient equilibrium, where growth and productivity are highly constrained by the size of the domestic market but hold on because of the high potential social and economic costs of lifting trade protection.
Report Growth Diagnostics and Competitiveness Study of the Manufacturing Sector in Tanzania 105
3. Policy Implications
3.1. Growth Diagnostics Recommendations

3.1.1. CTI ’s role
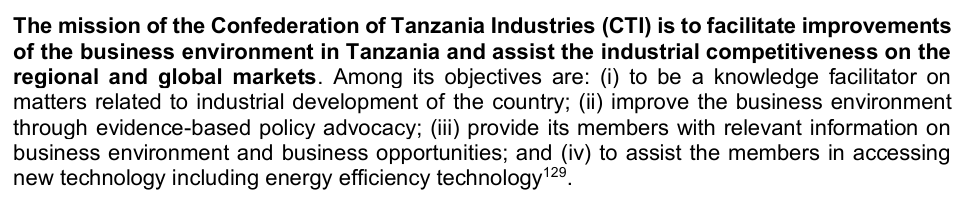
3.1.2. Electricity
Report Growth Diagnostics and Competitiveness Study of the Manufacturing Sector in Tanzania 106

Even though the hydro and gas projects will help increase local installed capacity, they must be further accompanied by investments in transmission and distribution and complemented by increasing the diversity of the energy mix. While generation projects could be expanded to further promote the use of renewable energy sources, such as solar, wind, and bioenergy, they do not solve the constraint if they are not accompanied by investments in transmission and distribution. While power transmission and distribution losses have gone down from their peak in 2010, firms still complain about the unstable power supply and voltage fluctuations. These are related to the infrastructure of transmission lines which require high investment and are slow in implementation. Recently, the government signed and started the implementation of several grid extension and enhancement projects, for example, through initiatives such as the Tanzania Energy Development and Access Project (TEDAP) and the Mbeya-Shinyanga line, which is also referred to as the Backbone Transmission Investment Project. While the emphasis on further facilitation is crucial and must remain, more decentralized power generation should be also explored, along with more emphasis and support given to independent power producers.
The immediate problem of trade policy is not necessarily its efficiency, but the fact that the space for further manufacturing growth through import substitution is small and insufficient to meet the stated goals of increasing manufacturing’s share of GDP. Imports as a share of GDP are small, at half the level recorded a decade ago. Where Tanzania does have significant margin for growth – which could lead to an increase in manufacturing jobs and share of GDP – is the export sector. The general benefit of the export sector is that output is not subject to the relatively small size and pace of growth of the domestic market, nor subject to the impacts of terms of trade shocks on domestic demand. Thus, a general enhancement to trade facilitation is essential. This includes revising non-tariff barriers to exports, streamlining customs procedures, and improving trade-related infrastructure.
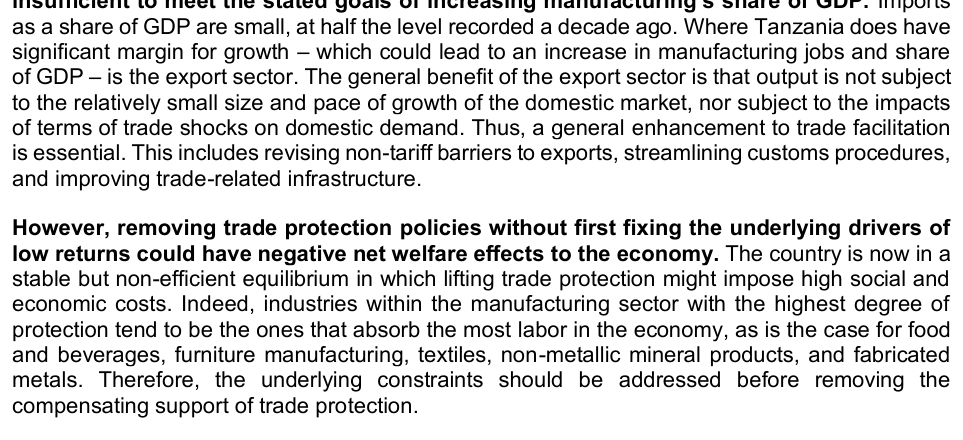
Report Growth Diagnostics and Competitiveness Study of the Manufacturing Sector in Tanzania 107
The key constraints identified in this report – electricity, land availability, and other microeconomic risks to appropriability – are particularly prevalent for export-oriented firms . As with electricity, the anti-export consequences of current policies are not new, being the central focus of the work Dinh & Monga (2013) one decade ago. Since then, policy efforts to tackle those issues have been pursued, but only superficially – by creating EPZs and nominally targeting a narrow set of exporters. In terms of implementation and delivery there are not many results visible, and Tanzania’s manufacturing exports have continued to stagnate. At the same time, trade protection does not necessarily require an anti-export bias: the case of Vietnam proves that highly protected manufacturing sectors can grow both in the domestic and international markets. While the highest levels of protection in Tanzania are associated with lower exports, in Vietnam they were associated with higher exports in the period preceding their export boom (2007-2009). There are several hypotheses that could explain that pattern and should be subject to further research. First, it might be the case that in Vietnam – as opposed to Tanzania – protection was granted by means of policies that were conditional on exports. Second, Tanzania targets capital intensive industries for protection to a much higher degree than Vietnam, where there is a negative correlation between sectors’ capital intensity (measured by gross capital formation per worker) and trade protection. Thus, Vietnam tended to target labor-intensive industries where it enjoyed competitive advantages, like wearing apparel and leather products, which created an implicit export promotion effect (Figure 127). Our results suggest that trade policy should be revised in conjunction with other policy areas to build an internally consistent export-led strategy for Tanzania’s next stage of manufacturing growth . This requires a focus on the manufacturing sub-sectors with the highest potential to deliver export growth in Tanzania, and the most binding constraints that are preventing investment in these sectors. As the Vietnam case suggests, such a policy might not necessarily entail the immediate removal of tariff and non-tariff barriers. However, the government could find ways to work in parallel towards eliminating the compensating mechanisms that have been granted to manufacturing firms (tax holidays, trade protection) while in parallel addressing the electricity constraints that are binding manufacturing across the board, plus other constraints that might be more relevant for specific sub-sectors – such as access to serviced land, finance and excessive regulations and red tape. At first, while these issues are sorted at the national level, the efforts shall be focused on addressing them within the restricted perimeter of special economic zones. To encourage the development of new export-oriented manufacturing sectors, temporary support in the form of low or zero tariffs on intermediate inputs could also be incorporated.
Figure 127: Exports and capital formation by levels of maximum tariff
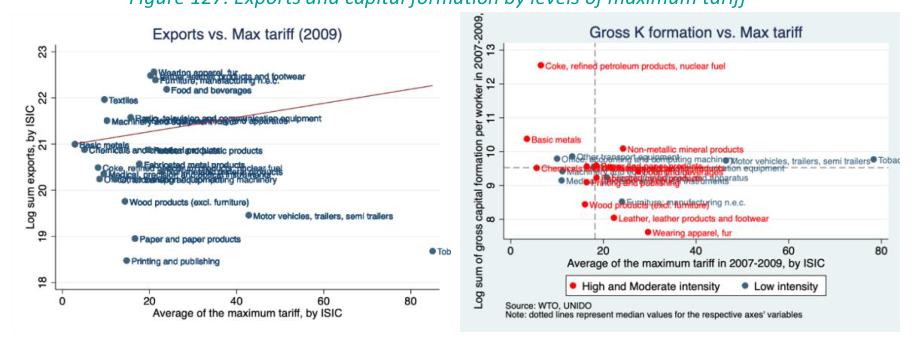
Source: Own elaborations based on WTO, UNIDO.
Report Growth Diagnostics and Competitiveness Study of the Manufacturing Sector in Tanzania 108
3.1.3 Special Economic Zones
Export Processing Zones and Special Economic Zones in Tanzania have neither solved nor alleviated the most binding constraints identified. Aside from the Benjamin William Mkapa SEZ in Dar es Salaam, most other zones exist only in name or as an abstract legal structure, as opposed to effective turnkey investment instruments. Potential investors must acquire and develop the land themselves, arrange utilities, work with all levels of government for utility connections and road access, etc. The country has an EPZA and TIC with accompanying legislation that points to some successes. However, compared to international competitors, these results are trifling, and accordingly, the amount of investment attracted has been minimal.
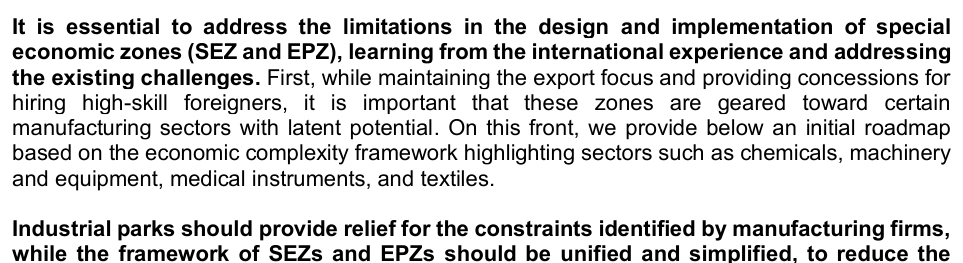
Industrial parks should provide relief for the constraints identified by manufacturing firms, while the framework of SEZs and EPZs should be unified and simplified, to reduce the regulatory burden associated with them. The government has already acknowledged the barriers for SEZs to become effective investment enablers – as described in the 2019-2024 Strategic Plan for EPZA – but it is important to follow up on the diagnostic with effective interventions within an adequate timeframe. The plan sets out the following main objectives: provision of adequate serviced land, harmonization of SEZs laws at the national and regional levels, financial resources mobilization, and management capability enhancement. The plan also intends to address red tape through improving legal and regulatory framework and enhance institutional and human capacity development. However, the list should also include the provision of adequate and reliable electricity, availability of technical support within the zones, and potentially differentiated labor regimes. To tackle issues highlighted here regarding misallocations of zones and inputs (particularly labor) as well as coordination issues more broadly, the zones should be located near existing knowhow agglomeration, adjoining reliable trade infrastructure (for example, near ports), and where there is the availability of cheap labor.
A potential expansion of the SEZ and EPZ model would benefit from adopting publicprivate model, with a transparent governance mechanism that ensures coordination and high-level political support, and delegates the zones ’ management to private contracts. The international context – as in the cases of the Dominican Republic, Panama, or states in the north of Mexico – provides a model where zones are tendered to a private administrator or real estate concessionary that has enough incentives to run them profitably. In a decentralized model based on the government granting concessions to selected private administrators, the public sector commits to making the investments required to sort out the constraints, and private sector actors bid money to administer the zone, earning a return on their investment. Thus, an agreement where government provides the missing inputs required by latent manufacturing industries, SEZ and EPZs participants would not have to wait for the problem to be sorted countrywide.

With private initiative and capital introduced into the management of the zones, returns would be further improved by decreasing the cost of finance with capital market reforms and further deepening of the financial system. The government would need to work with financial institutions to develop financing models that are tailored to meet the needs of the manufacturing sector, with solutions linked to other export-promoting initiatives, such as subsidized interest rates or special loan conditions for exporting firms located in the EPZs.
Report Growth Diagnostics and Competitiveness Study of the Manufacturing Sector in Tanzania 109
3.1.4 Human capital and skill development
Although the evidence suggests that human capital is not the binding constraint in the manufacturing sector, some policies can be advanced to increase the supply of skills needed by the manufacturing sector. One effective policy to increase the supply of human capital for the manufacturing sector is through the recruitment of foreign workers. If migration is geared towards highly skilled foreign workers, they will bring the knowhow required by latent manufacturing industries and act as a complement of Tanzanian workers, thus creating valueadded, exports or employment that would not have existed otherwise. Based on the ASIP data, we showed that foreigners working in Tanzania are heavily concentrated in high skills, which suggests that they tend to complement the skills of Tanzanians rather than substitute them.
This is important as the most restrictive aspect of labor in Tanzania is related to hiring foreign workers, though recent (2021) legal changes introduced some improvements. Tanzania performs worse than peers in the ease of hiring foreign labor indicator. Furthermore, in 2015 the country’s parliament approved a law to curb foreign employment 131 . Then the 2021 Written Laws amended the Non-Citizens Act of 2015 132 . The changes included an extension for work permits of non-citizens from five to eight years and incentives for registered investors 133 who can now employ up to ten non-citizens without being subject to the conditions of the Act of 2015. As a result, during the visit to Tanzania, several companies mentioned that the supply of skills used to be a problem, but the change made in 2021 facilitated access to skilled labor. Thus, our recommendation is to maintain and strengthen the efforts to facilitate the hiring of foreigners in the manufacturing sector, along with complementary longer-term investments in upgrading the economy’s capacity in science, technology, and innovation, as well as higher education.
3.2. Diversification opportunities for the manufacturing sector
Quantifying the levels of existing knowhow in the manufacturing sector in Tanzania and the latent productive capability allowed us to develop a list of potential diversification opportunities in the manufacturing sector. This exercise is an initial contribution for an iterative process – involving a variety of stakeholders from government, academia, industry experts, civil society – to prioritize efforts around productive diversification and investment promotion. This effort is largely based on the economic complexity framework. Although this is just one among several other approaches to explore place-specific diversification paths, economic complexity has the advantage that it is data-driven and based on the notion of redeploying existing productive capacities into industries of higher value added is conducive to growth. This knowhow-based approach captures observed diversification paths for the country better than beneficiation strategy (add value to raw materials) that has prevailed in national development strategies across Africa.
Results from the report suggest that Tanzania does need to diversify into new, more sophisticated export activities that can scale up and bring higher wages, employment, and economic growth . Currently, manufacturing exports are highly dependent on basic metals (gold and unrefined copper), which makes the export basket vulnerable to external shocks. To move beyond the current export concentration, export growth and the diversification for the manufacturing sector will come from a combination of industries which already exist and can be scaled up (intensive margin), and new ones with high potential to emerge (extensive margin).
The process we used for sectoral identification starts by filtering the products of the manufacturing sector, and then identifying the sectors in the intensive and extensive margin . Only products from the manufacturing sector were taken into consideration in the process, which was based on the International Standard Industrial Classification (ISIC, Revision 3) product classification. Under this definition, manufacturing includes units engaged in the physical or chemical transformation of materials, substances, or components (inputs) into new Report Growth Diagnostics and Competitiveness Study of the Manufacturing Sector in Tanzania 110
products. Once the sample of products has been restricted to the manufacturing sector as described above, the next step is to choose the existing products that can be potentially contribute more (intensive margin) and the new emerging products that can be successfully developed by redeploying existing productive capacities (extensive margin)
Industries identified on the intensive margin are taken from the pool of products where RCA is greater than one (products with a relatively larger presence in Tanzania than in the rest of the world). Industries identified in the extensive margin are taken from the set of products with an RCA less than one (relatively lower presence in Tanzania than in the rest of the world). Economic Complexity metrics (see Appendix 1) as Product Complexity Index (PCI), Complexity Outlook Gain (COG), and Proximity (the inverse of Distance) are used to identify diversification opportunities. Proximity indicates how similar are the productive capacities required by two products and helps to identify “nearby products” that demand similar knowhow and could be developed by redeploying existing knowhow in the sector (RCA >1). PCI indicates the complexity of a product, serving as proxy of the diversity of skills required to develop a certain product. COG measures the strategic value of developing a product, by estimating how attractive the products that are nearby a certain product are.
The industry selection for Tanzania in this report does not account for environmental criteria. Yet, opportunities for increasing economic complexity and economic diversification would also be affected by climate change and the global decarbonization process. These characteristics could also be further analyzed in new research. Previous Growth Lab studies have considered the use of these variables for the selection of new priority sectors. Additional criteria of environmental sustainability, attractiveness, and viability were part of the prioritization system to narrow the selection of the industries to develop in some specific regions (Hausmann et al., 2023). For example, in a previous growth diagnostic for the state of Loreto, Peru; selection criteria for priority industries included five environmental impact metrics selected from the US Environmentally Extended Input-Output (USEEIO) matrix. In the cases of Loreto, the five metrics included the industries were selected by considering the variables that were more relevant to that particular context: detriment to water quality and aquatic biodiversity, deforestation potential by land use intensity, ecological contamination by toxic substances, air pollution by toxic substances, and emission of greenhouse gases. The USEEIO matrix includes 19 criteria which some can be tailored to selection criteria depending on the context and could be applied to select priority industries in for Tanzania’s manufacturing sector.
The results of the process for the intensive margin indicates a total of existing 50 products that can be leveraged to spur manufacturing growth. The selection of products can be divided into twelve manufacturing subsectors (Figure 128). The results of this exercise indicate positive deviants in the manufacturing sector in Tanzania. These are existing products that have potential to grow further and increase the average level of sophistication of the Tanzanian economy – their PCI is higher than the overall ECI for Tanzania’s manufacturing sector. The subsector with higher number of positive deviants is chemicals and chemical products (10 products), followed by food and beverages (7 products), and non-metallic mineral products (6 products). Some examples of products in the chemical subsector are hydraulic fluids, make-up preparations, dental hygiene products, and cleaning products, among others 134 . Food and beverages products consider meat, soft drinks, water, solid vegetable oil and fat residues. These products are an example of industries that exist in the country and that can be prioritized to increase the complexity of the manufacturing export basket.
Report Growth Diagnostics and Competitiveness Study of the Manufacturing Sector in Tanzania 111
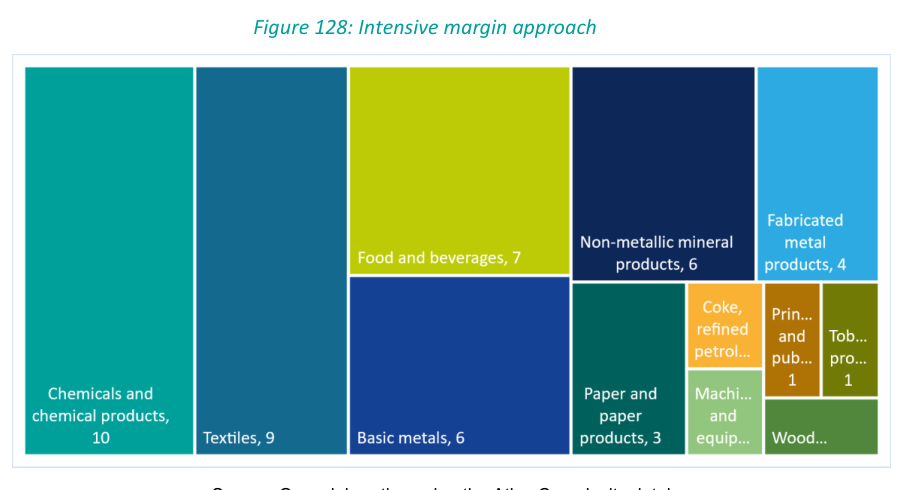
Source: Own elaboration using the Atlas Complexity database.
On the extensive margin we have identified 54 products with high potential to spur export diversification and classified them into 7 subsectors. Based on Tanzania’s current capabilities, we obtained a total of 54 products that the country can specialize in based on the strategic bets strategy and the parsimonious industrial policy. For policy purposes these products have been group into 7 manufacturing sub-sectors (Figure 129). The final list prioritizes both complexity and the likelihood of developing that product based on the current capabilities of the country (proximity). Machinery and equipment concentrate 18 products, including the manufacture of machinery for mining, quarrying and construction, pumps, bearing, gears, among other products 135 . While priority products in the chemicals sector include plastics in primary forms, lubricants, polyamides, among others.
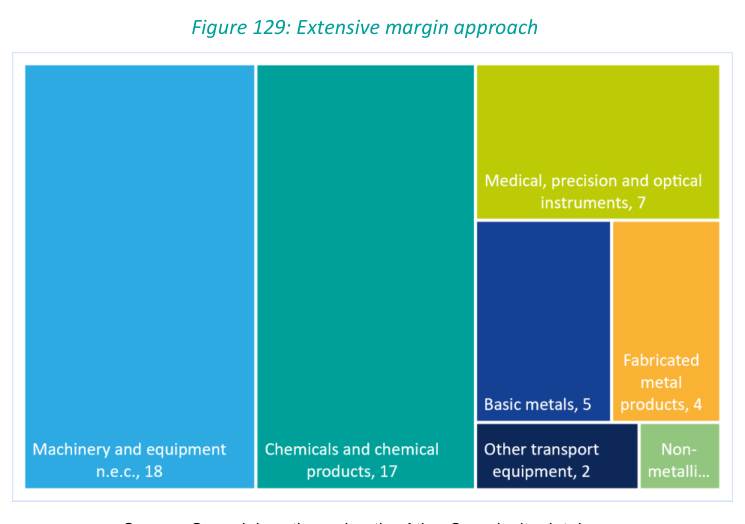
Source: Own elaboration using the Atlas Complexity database.
Report Growth Diagnostics and Competitiveness Study of the Manufacturing Sector in Tanzania 112
Abbreviations
AGOA African Growth and Opportunities Act AfCFTA African Continental Free Trade Area ASIP Annual Survey Industrial Production BoT Bank of Tanzania CCRO Customary Right of Occupancy CET Common External Tariff COI Economic Complexity Outlook Index COG Complexity Outlook Gain COMESA Common Market for Eastern and Southern Africa DB Doing Business EAC East African Community EBA Everything But Arms ECI Economic Complexity Index EPZ Export Processing Zones EPZA Export Processing Zone Authority ES Enterprise Survey EWURA Energy and Water Utilities Regulation Authority FDI Foreign Direct Investment FSDA Financial Sector Assessment Program FYDP Five Years Development Plan GDP Gross Domestic Product GFC Global Financial Crisis GII Global Innovation Index GNI Gross National Income GRO Granted Right of Occupancy GVA Gross Value Added IFC Investment Climate Assessment ILO International Labor Organization ILFS Integrated Labor Force Survey IMF International Monetary Fund ISI Import Substitution Industrialization ISIC International standard industrial classification of all economic activities JNIA Juluis Nyere International Airport LAYS Leaning-Adjusted Years of Shcooling LPI Logistics Performance Index MIIT Ministry of Investment, Industry and Trade MoEST Ministry of Education, Science and Technology MVA Manufacturing Value Added NAWAPO National Water Policy NBS National Bureau of Statistics NPL Non-Performing Loans OECD The Organization for Economic Cooperation and Development PCI Product Complexity Index PWC PricewaterhouseCoopers RCA Revealed Comparative Advantage REA Rural Energy Agency ROE Return on Equity ROA Return on Assets SADC Southern African Development Community SDL Skills Development Levy SEZ Special Economic Zones TAA Tanzania Airport Authority TANESCO Tanzania Electric Supply Company Limited TIC Tanzania Investment Centre TCRA Tanzania Communications and Regulations Authority TPA Tanzania Port Authority TRA Tax Revenue Authority TRC Tanzania Railways Corporation

Report Growth Diagnostics and Competitiveness Study of the Manufacturing Sector in Tanzania 113
UK FDCO Foreign, Commonwealth & Development Office UNIDO United Nations Industrial Development Organization USAID U.S. Agency for International Development VAT Value Added Tax VET Vocational Education and Training WORLD BANK World Bank WORLD BANKES World Bank Enterprise Survey WDI World Development Indicators ZECO Zanzibar Electricity Corporation
Databases
ASIP panel data – up to 2016 Atlas Complexity data – up to 2020 Bank of Tanzania data – up to 2021 Doing Business Indicators – up to 2020 Global Competitiveness Index – up to 2020LO International Labor Organization – up to 2022 International Energy Agency data – up to 2020 (forecast until 2030) Integrated Labor Survey – 2014 and 2020/21 round Learning Adjusted Years of Schooling (LAYS) database – up to 2018 Our World in Data – up to 2021 Tanzania National Bureau of Statistics data – up to 2021 TANESCO data – up to 2022 UN COMTRADE data – up to 2020 UNIDO database, up to 2020 World Economic Forum indicators – Up to 2017 World Bank Indicators data – up to 2021 World Bank Enterprise Survey – 2006 and 2013 for Tanzania World Trade Organization – up to 2020 Report Growth Diagnostics and Competitiveness Study of the Manufacturing Sector in Tanzania 114
Bibliography
A Joint Analysis for the Governments of the United Republic of Tanzania and the United States of America. “Tanzania Growth Diagnostic. Partnership for Growth” (2011). https://2009- 2017.state.gov/documents/organization/202534.pdf .
Aikaeli, Jehovaness, and Beatrice Kalinda Mkenda (2013) . “Determinants of Informal Employment: A Case of Tanzania Construction Industry.” SSRN Electronic Journal. https://doi.org/10.2139/ssrn.2706021 .
Aikaeli, Jehovaness, and Thomas Markussen (2022) . “Titling and the Value of Land in Tanzania.” Journal of International Development 34, no. 3, pp. 512 – 31. https://doi.org/10.1002/jid.3615 .
Ali, Merima, Odd-Helge Fjeldstad, and Ingrid Hoem Sjursen (2014) . “To Pay or Not to Pay? Citizens’ Attitudes toward Taxation in Kenya, Tanzania, Uganda, and South Africa.” World Development 64, pp. 828 – 42.
Andreoni, Antonio, Julian Boys, and Ole Therkildsen (2022) . “The Political Economy of ‘Specialism’in Tanzania: How to Make Export Processing Zones Work via Conditional Special Licensing”.
Bank of Tanzania (2020) . “Monetary Policy Statement”. https://www.bot.go.tz/Publications/Regular/Monetary%20Policy%20Statement/en/20200615153 11396.pdf .
Bellora, Cecilia, and Lionel Fontagne (2019) . “Shooting Oneself in the Foot? Trade War and Global Value Chains.” SSRN Electronic Journal. https://doi.org/10.2139/ssrn.3526944 .
Curtis, M., and H. P. Ngowi (2017) . “ The One Billion Dollar Question: How Much Is Tanzania Now Losing in Potential Tax Revenues.” Dar Es Salaam, Tanzania Episcopal Conference, National Muslim Council of Tanzania and Christian Council of Tanzania, Dar Es Salaam. p 62.
Diao, Xinshen, Mia Ellis, Margaret S. McMillan, and Dani Rodrik (2021) . “Africa’s Manufacturing Puzzle: Evidence from Tanzanian and Ethiopian Firms.” Working Paper. Working Paper Series. National Bureau of Economic Research. https://doi.org/10.3386/w28344 .
Diaz-Alejandro, Carlos (1985) . “Good – Bye Financial Repression, Hello Financial Crash.” Journal of Development Economics 19, no. 1 – 2, pp. 1 – 24.
Dinh, Hinh T., and Célestin Monga (2013). Light Manufacturing in Tanzania: A Reform Agenda for Job Creation and Prosperity. World Bank Publications.
ESRF (2010) . “Informal Sector Taxation in Tanzania.” TAKNET Policy Brief.
Gelb, Alan, Christian Meyer, Vijaya Ramachandran, and Divyanshi Wadhwa (2017) . “Can Africa Be a Manufacturing Destination? Labor Costs in Comparative Perspective.” Center for Global Development Working Paper No. 466.
Gray, Hazel (2020) . “Tanzania: From Institutional Hiatus to the Return of Policy – Based Lending.” In The Political Economy of Bank Regulation in Developing Countries: Risk and Reputation, 196 – 217. Oxford University Press.
Hausmann, Ricardo, Bailey Klinger, and Rodrigo Wagner (2008) . “Doing Growth Diagnostics in Practice: A ‘Mindbook.’” CID Working Paper Series.
Hausmann, Ricardo, and Dani Rodrik (2003) . “Economic Development as Self – Discovery.” Journal of Development Economics 72, no. 2, pp. 603 – 33.
Report Growth Diagnostics and Competitiveness Study of the Manufacturing Sector in Tanzania 115
Hausmann, Ricardo, Miguel Angel Santos, Jorge Tudela, Frank Mucci, Yang Li, Fernando Miralles-Wilhelm, Ana Cristina Grisanti, Jessie Lu (2023) . “Looking for virtue in remoteness: Policy Recommendations for Sustainable and Inclusive Growth in the Peruvian Amazonia”. CID Faculty Working Paper no. 388.
Hausmann, Ricardo; Dani Rodrik and Andres Velasco (2008). Growth diagnostics, in Stiglitz, J. and Serra, N. The Washington Consensus Reconsidered: Towards a new global governance. (Chapter 15). Oxford University Press, NY.
IMF (2016). “United Republic of Tanzania: Selected Issues.” https://www.imf.org/en/Publications/CR/Issues/2016/12/31/United-Republic-of-Tanzania- Selected-Issues-44138 .
——— (2016). “United Republic of Tanzania: Staff Report for the 2016 Article IV Consultation for The United Republic of Tanzania.” Accessed March 10, 2023. https://www.imf.org/en/Publications/CR/Issues/2016/12/31/United-Republic-of-Tanzania-Staff- Report-for-the-2016-Article-IV-Consultation-and-Fourth-44136 .
——— (2018). United Republic of Tanzania: Financial System Stability Assessment. International Monetary Fund.
——— (2021) . “United Republic of Tanzania: Country Report No. 2021/213.” Accessed January 16, 2023. https://www.imf.org/en/Publications/CR/Issues/2021/09/16/United-Republic-of- Tanzania-Requests-for-Disbursement-Under-the-Rapid-Credit-Facility-and-465880.
_____ (2022). “IMF Staff Country Reports: United Republic of Tanzania: Request For a 40 – Month Arrangement Under The Extended Credit Facility”. https://www.elibrary.imf.org/view/journals/002/2022/269/002.2022.issue-269-en.xml .
International Bank for Reconstruction and Development/The World Bank (2017). “Tanzania DTIS” https://documents1.worldbank.org/curated/en/527091529931822621/pdf/TanzaniaDTIShighRes-05.pdf .
Kawar, Mary (2017) . “Decent Work for Sustainable Development in Tanzania.” ILO. http://www.ilo.org/africa/WCMS_573496/lang–en/index.htm .
Kessy, Pantaleo J., Johnson Nyella, and AO’ Connell Stephen (2017) . “Monetary Policy in Tanzania.” Africa: Policies for Prosperity Series, pp. 241.
Khan, Muhammad Adil, Kamran Zeb, P. Sathishkumar, S. Srinivasa Rao, Chandu VV Muralee Gopi, and Hee-Je Kim (2018) . “A Novel Off -Grid Optimal Hybrid Energy System for Rural Electrification of Tanzania Using a Closed Loop Cooled Solar System.” Energies 11, no. 4: 905.
Kinyondo, Abel, Carol Newman, and Finn Tarp (2016) . “WIDER Working Paper 2016/122 The Role and Effectiveness of Special Economic Zones in Tanzania”.
Michelsen Institute, CMI (2016). “Non -Resource Taxation in a Resource Rich Setting: A Broader Tax Base Will Enh ance Tax Compliance in Tanzania.” Bergen: Chr. Michelsen Institute (CMI Brief vol. 14 no. 8).
Ministry of Education, Science and Technology (2018 ). “Education Sector Development.
Nord, Roger, Yuri V. Sobolev, David G. Dunn, Alejandro Hajdenberg, Niko A. Hobdari, Samar Maziad, and Stéphane Roudet (2009) . “Tanzania: The Story of an African Transition”.
Nordhaus, William D (1969) . “An Economic Theory of Technological Change.” The American Economic Review 59, no. 2, pp. 18 – 28.
OECD (2013) . “OECD Investment Policy Reviews: Tanzania 2013 ” Paris: OECD. https://doi.org/10.1787/9789264204348-5-en .
Report Growth Diagnostics and Competitiveness Study of the Manufacturing Sector in Tanzania 116
Psacharopoulos, G. and Harry A. Patrinos (2018) . “Returns to Investment in Education: A Decennial Review of the Global Literature.” Education Economics 26, no. 5 , pp. 445 – 58.
PWC (2021). “Tax Alert: Pre – Budget Tax Briefing 2: Taxes on Employment”. https://www.pwc.co.tz/assets/pdf/tax-alert-pre-budget-2-tax-on-employment.pdf .
______ (2023) . “Tanzania Tax Overview” .
Rajan, Raghuram G., and Luigi Zingales (1998). “Financial Dependence and Growth.” The American Economic Review 88, no. 3, pp. 559 – 86.
Rauschendorfer, J, and A Twum (2020) . “Unmaking of a Customs Union: Regional (Dis)Integration in the East African Community” (mimeo).
SOAS (2018). “Realigning Incentives , Taking Differences into Account: Towards Evidence-Based Reforms of the Skills Development Sector in Tanzania”. https://ace.soas.ac.uk/wpcontent/uploads/2022/04/ACE-BriefingPaper004-TZ-AntiCorruption-skills.pdf .
Santos, Miguel Angel, and Farah Hani (2021). Diagnosing Human Capital as a Binding Constraint to Growth: Tests, Symptoms and Prescriptions. Cambridge University Press.
Schneider et al (2018) . “Shadow Economies Around the World: What Did We Learn Over the Last 20 Years?” IMF. Accessed January 13, 2023. https://www.imf.org/en/Publications/WP/Issues/2018/01/25/Shadow-Economies-Around-the- World-What-Did-We-Learn-Over-the-Last-20-Years-45583 .
Schneider, Friedrich, Marcel Thum, and Georg Tillmann (2010) . “Shadow Economies All over the World.” edited by Bengt -Arne Wickström. Duncker & Humblot, 2010. https://doi.org/10.2307/j.ctv1q69q48 .
Schwab, Klaus (2019) . “The Global Competitiveness Report”. World Economic Forum. https://apo.org.au/node/262576 .
Shkaratan, Maria (2012) . “Tanzania’s Infrastructure: A Continental Perspective.” World Bank Policy Research Working Paper, no. 5962.
Tanzania Revenue Authority (2020) . “Taxes and Duties at a Glance”.
Trimble, Christopher Philip, Masami Kojima, Ines Perez Arroyo, and Farah Mohammadzadeh (2016) . “Financial Viability of Electricity Sectors in Sub -Saharan Africa: Quasi-Fiscal Deficits and Hidden Costs.” World Bank Policy Research Working Paper, no. 7788.
Tyler, William G (1983) . “The Anti -Export Bias in Commercial Policies and Export Performance: Some Evidence from the Recent Brazilian Experience.” Weltwirtschaftliches Archiv 119, no. 1 , pp. 97 – 108.
United Republic of Tanzania (2002) . “The Export Processing Zones Act”. https://www.epza.go.tz/uploads/documents/en-1614619789-EPZ%20regulations.pdf .
United Republic of Tanzania (2022) . “National Five -Year Development Plan FYDP II 2016/17- 2021/22” . https://extranet.who.int/nutrition/gina/sites/default/filesstore/FYDP2_II__April%201.pdf .
——— (2021) . “National Five -Year Development Plan FYDP III 2021/22- 2025/26,” n.d. https://www.tro.go.tz/wp-content/uploads/2021/06/FYDP-III-English.pdf .
United Republic of Tanzania, MIT. “Integrated Industrial Development Strategy IIDS 2025,” n.d. https://www.mit.go.tz/uploads/documents/sw-1620119076- IIDS%20Main%20Report%20signed.pdf.
Report Growth Diagnostics and Competitiveness Study of the Manufacturing Sector in Tanzania 117
———. “Sustainable Industries Development Policy SIDP (1996 – 2020),” n.d. http://www.tzonline.org/pdf/sustainableindustrial.pdf .
USAID (2013) . “USAID Country Profile: Land Tenure and Property Rights. Tanzania”. https://www.land-links.org/wpcontent/uploads/2016/09/USAID_Land_Tenure_Tanzania_Country_Profile.pdf .
Uwazu ‐ Twaweza (2010) . “Tanzania’s Tax Exemptions: Are They Too High and Making Us Too Dependent on Foreign Aid?”. https://twaweza.org/wp-content/uploads/2021/05/Tanzania-Taxexemptions.pdf .
Vermeulen, Sonja, and Lorenzo Cotula (2010). “Over the Heads of Local People: Consultation, Consent, and Recompense in Large- Scale Land Deals for Biofuels Projects in Africa.” The Journal of Peasant Studies 37, no. 4, pp. 899 – 916. https://doi.org/10.1080/03066150.2010.512463 .
Wangawe S et al (2014) . “The Performance of the Manufacturing Sector in Tanzania. Challenges and the Way Forward.” WIDER Working Paper 2014/085.
World Bank (2004) . “Investment Climate Assessment: Improving Enterprise Performance and Growth in Tanzania”. http://hdl.handle.net/10986/14413 .
——— (2019) . “Tanzania Economic Update”. https://doi.org/10.1596/32177 .
——— (2017). United Republic of Tanzania Systematic Country Diagnostic: To the Next Level of Development. World Bank.
——— (2015) . “Why Should Tanzanians Pay Taxes?: The Unavoidable Need to F inance Economic Development”. https://www.worldbank.org/content/dam/Worldbank/document/Africa/Tanzania/Report/tanzaniaeconomic-update-why-should-tanzanians-pay-taxes-the-unavoidable-need-to-finance-economicdevelopment.pdf .

World Trade Organization (2019) . “Trade Policy Review: East African Community (EAC)” https://www.wto.org/english/tratop_e/tpr_e/s384_e.pdf .
Report Growth Diagnostics and Competitiveness Study of the Manufacturing Sector in Tanzania 118
Appendix
Appendix 1: Economic complexity framework
Structural transformation – understood as the transition from agriculture to industry and services, or from labor-intensive to capital-intensive and human capital-intensive sectors – is an integral part of the development process. The evolution of the analytical frameworks to process large quantities of data at a disaggregated level has allowed for a much more nuanced understanding of this process, with significant implications for industrial policy. In this section, we summarize the economic complexity framework as it relates to evaluating the process of structural transformation in Tanzania, and the potential role o f coordination failures in hindering the growth of the country’s manufacturing sector.
In general, developed countries tend to manufacture and export a large number of products (high diversity) which only a small number of countries are able to successfully produce (low ubiquity). Meanwhile, poor countries produce a low number of products (low diversity) which are themselves made by many other countries (high ubiquity) (Appendix 1). The process of structural transformation entails transitioning from producing a small number of highly ubiquitous products to a wider variety of more sophisticated products of lower ubiquity. That process in some ways lines up with the generalized story of transitioning from agriculture to industry to services sectors, but in many ways, it does not. For example, there are some manufacturing activities that are relatively unsophisticated and ubiquitous, some agricultural activities that are quite sophisticated and specialized, some manufacturing activities with a large service component, and so on.
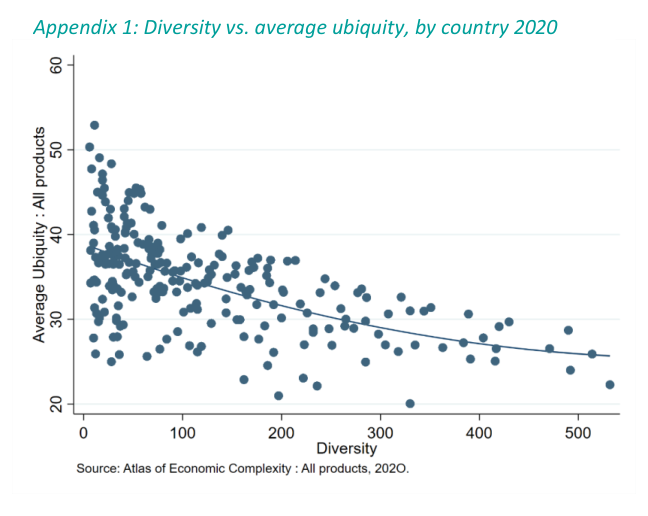
These results place an emphasis on the accumulation of productive capacities and know-how as the path for transitioning towards more sophisticated activities that pay higher wages and fuel economic development. Those sophisticated productive activities that fewer countries can perform require increasingly larger agglomeration of know-how, and that know-how can be redeployed to produce a wider variety of activities which fuels diversification. As regions expand their knowhow or productive capacities, developing economies tend to diversify their production into activities that are less common and more valuable, capable to sustain higher levels of wages.
We can observe how that process unfolds over time in international trade data. This can be visualized as occurring in a ‘product space’, which shows all the potential export products and the links between them. Those links, or ‘distances’ between products, capture how similar or different Report Growth Diagnostics and Competitiveness Study of the Manufacturing Sector in Tanzania 119
is the know-how required to produce them. In Appendix 2 each node is a product, with size based on global export value, and the distance between the nodes indicates their technological similarity (how likely is to develop product A given that the country already produces B). 136 We can observe where countries are located within this product space, and how they move through it over time. The data show that countries tend to diversify into nearby activities that require similar know-how to those already in place. There is therefore a great deal of path dependency in the process of structural transformation, and a country’s opportunities for know -how accumulation and export diversification are governed by what is nearby their current position in the product space.
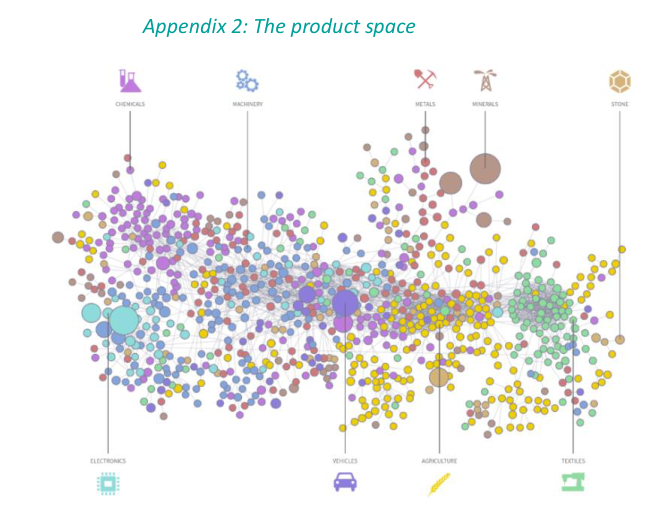
There are other relevant concepts in the economic complexity methodology that allow to compare countries 137 in terms of their level of complexity, economic opportunities, prevalence of products, among others. The complete list of concepts related to the Economic Complexity framework that are used in the next section are the following 138 :
• Economic Complexity Index (ECI) is a summary measure that captures the sophistication of know-how embedded in a country or region based on what it produces. Countries that harbor a great diversity of productive knowledge, particularly complex know-how, can produce a variety of sophisticated products 139 . Hausmann, Hidalgo et al. (2014) show that the complexity of a country’s export highly predicts current income levels, and the error term between actual economic complexity and the level one would expect given its income is informative of future growth prospects. Countries where actual complexity exceeds the complexity one would expect given a country’s income level tended to grow faster in the future and vice versa. Therefore, ECI values are a good predictor of subsequent structural transformation and economic growth. shows the relation of those variables, accounting for the positive relationship between economic complexity and GDP per capita.
Report Growth Diagnostics and Competitiveness Study of the Manufacturing Sector in Tanzania 120
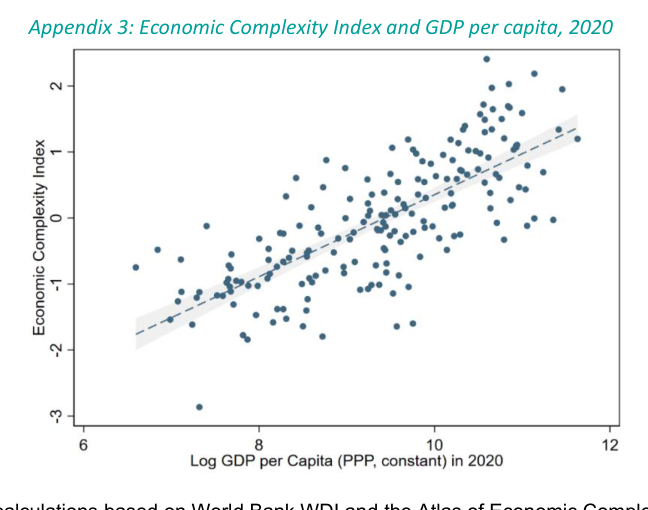
Source: Own calculations based on World Bank WDI and the Atlas of Economic Complexity database.
• Relative Comparative Advantage (RCA): A measure of whether a country-specific is an exporter of a product based on the relative advantage or disadvantage a country has in exporting a specific good. Following Balassa (1964), it is calculated as the ratio between the proportion of the product in the export basket of a place and the proportion of the product in world trade. Under this definition, a country is an effective exporter of a product if it exports more than a “fair share”, or a share that is at least equal to the share of total world trade that the product represent (RCA >1). • Product Complexity Index (PCI): This product-specific measure ranks the diversity and ubiquity of the productive knowledge required for its production. It is calculated by an interaction of the average variety of countries that produce the product and the average ubiquity of the other products that these countries develop. • Distance: A measure of a country’s ability to develop a specific product. A product’s distance (from 0 to 1) captures the extent of a country’s existing know -how to make the product as measured by how closely related a product is to its current exports. A ‘nearby’ product of a shorter distance requires related capabilities to those used in the other product, with greater likelihood of success. • Complexity Outlook Index (COI): A measure of the number of complex products near a country’s current set of productive capabilities. A high COI implies that the place has an easier path towards greater levels of complexity, while a low COI means that achieving them will be more difficult as it implies moving into products that are further away.
Report Growth Diagnostics and Competitiveness Study of the Manufacturing Sector in Tanzania 121
Appendix 2: Agenda trip to Tanzania
Trip Plan (Nov 28 – Dec 2)
Monday Nov 28 – Meetings in Dar es Salaam .
• Meeting N°1: Confederation of Tanzania Industries (CTI).
• Meeting N°2: Meeting with Tanzania Investment Centre (TIC).
• Meeting N°3: Export Processing Zones Authority (EPZA).
• Meeting N°4: NIDA Industries (Textiles and apparels).
Tuesday Nov 29 – Meetings Pwani Region • Meeting N°5: Azam Industries (Agro-processing).
• Meeting N°6: Alaf Industries (Metal and metal products).
• Meeting N°7: Plasco Industries (Plastic and plastic products).
Wednesday Nov 30 – Morogoro region.
• Meeting N°8: Alliance One Tobbaco Industries (Agro-processing).
• Meeting N°9: Wilmar Rice Mill Industries Limited (Agro-processing).
Thursday December 1- Meeting in Dodoma • Meeting N°10: National Bureau of Statistics.
• Meeting N°11: Ministry of Energy.
• Meeting N°12: Vice Present’s Office.
• Meeting N°13: Ministry of Investment, Industry and Trade.
Friday December 2 – Meetings Dar Es Salaam • Meeting N°14: Bank of Tanzania • Meeting N°15: European Business Group.
• Meeting N°16: CRDB Bank.
• Meeting N°17: Standard Chartered Bank.
• Meeting N°18: World Bank group Tanzania.
Online meetings 15 th – 19 th December : Online meetings with representatives of the private sector from Tanga, Mwanza, Arusha & Moshi regions.
Report Growth Diagnostics and Competitiveness Study of the Manufacturing Sector in Tanzania 122
Appendix 3: Growth trajectory
Appendix 4: Population growth and income per capita
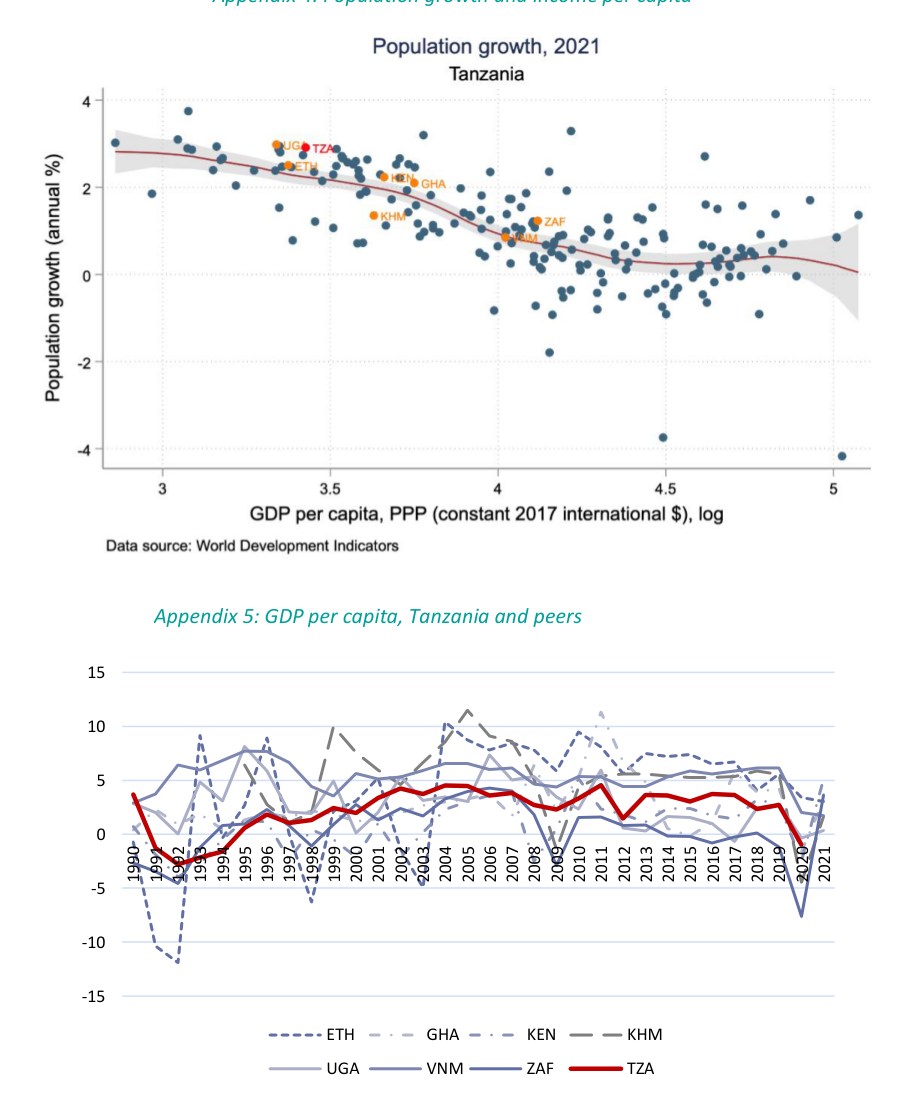
Source: Self-elaboration using WDI data.
Report Growth Diagnostics and Competitiveness Study of the Manufacturing Sector in Tanzania 123
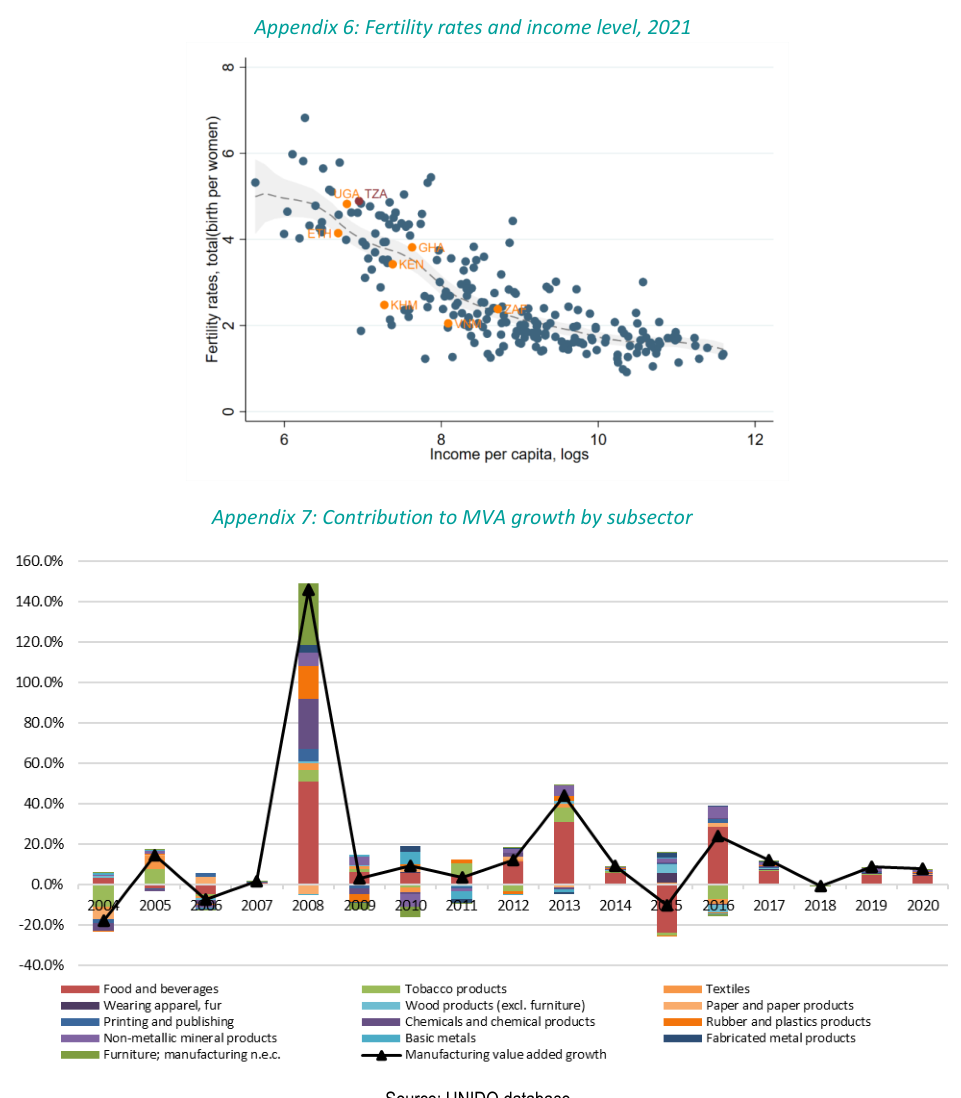
Source: UNIDO database.
Report Growth Diagnostics and Competitiveness Study of the Manufacturing Sector in Tanzania 124
Appendix 8:Manufacturing net exports composition, by product
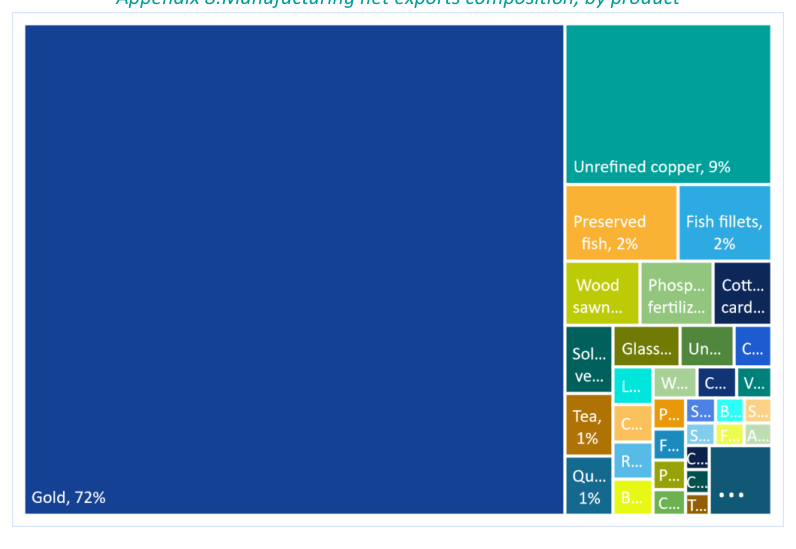
Appendix 4: Growth diagnostics
Appendix 9: Differential effect of density over the probability of jumping (2 periods with RCA over 1)
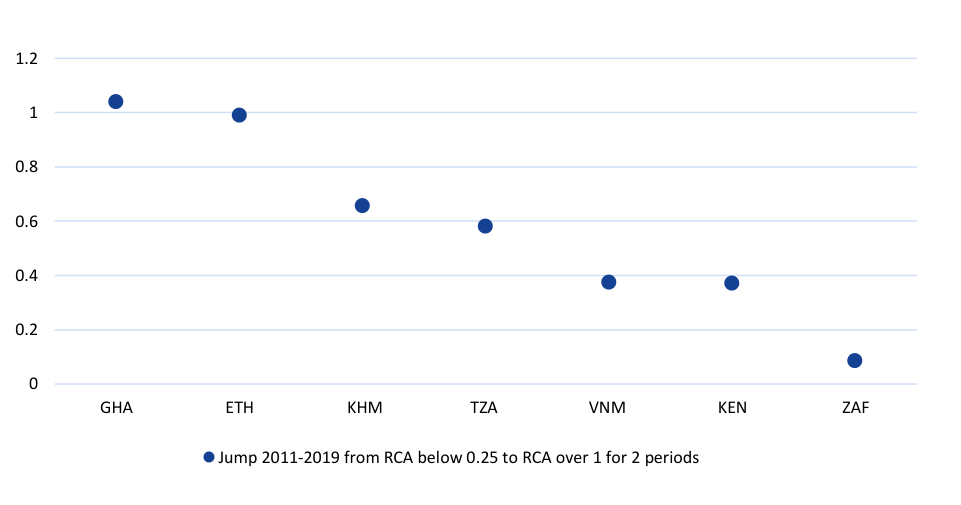
Report Growth Diagnostics and Competitiveness Study of the Manufacturing Sector in Tanzania 125
Appendix 10: Electricity consumption
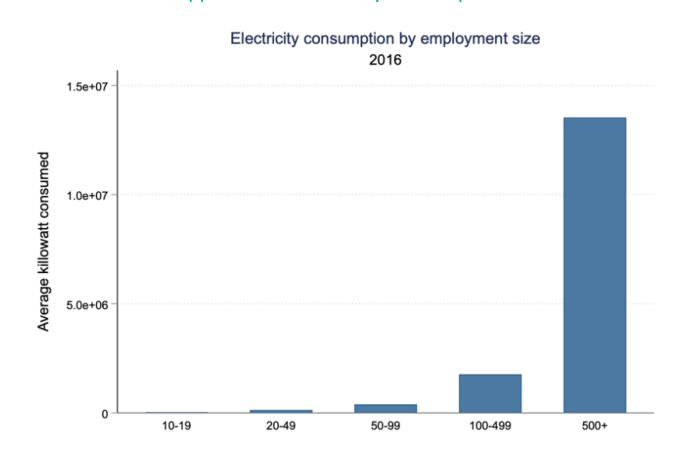
Appendix 11: Manufacturing value added
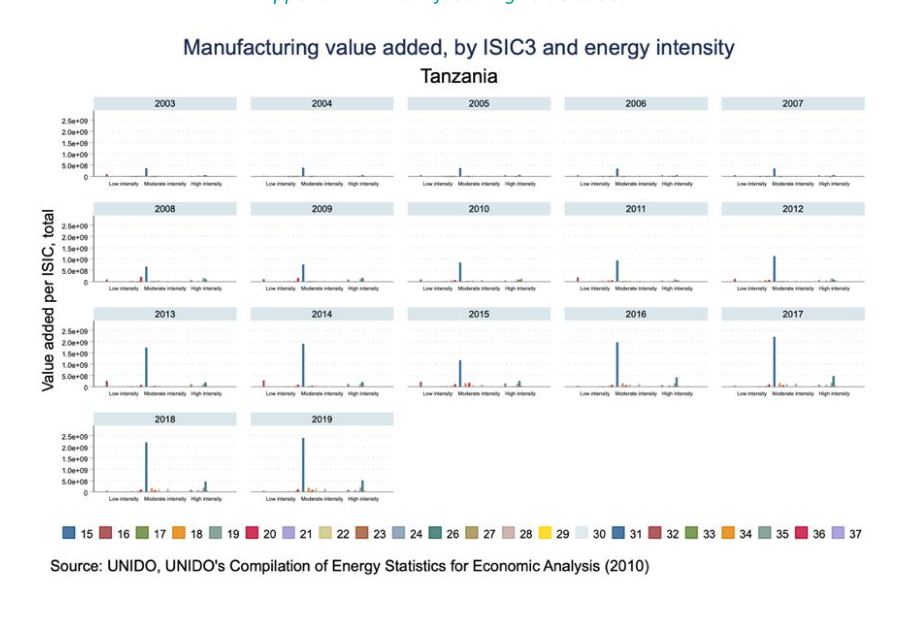
Report Growth Diagnostics and Competitiveness Study of the Manufacturing Sector in Tanzania 126
Appendix 12: manufacturing exports by energy intensity
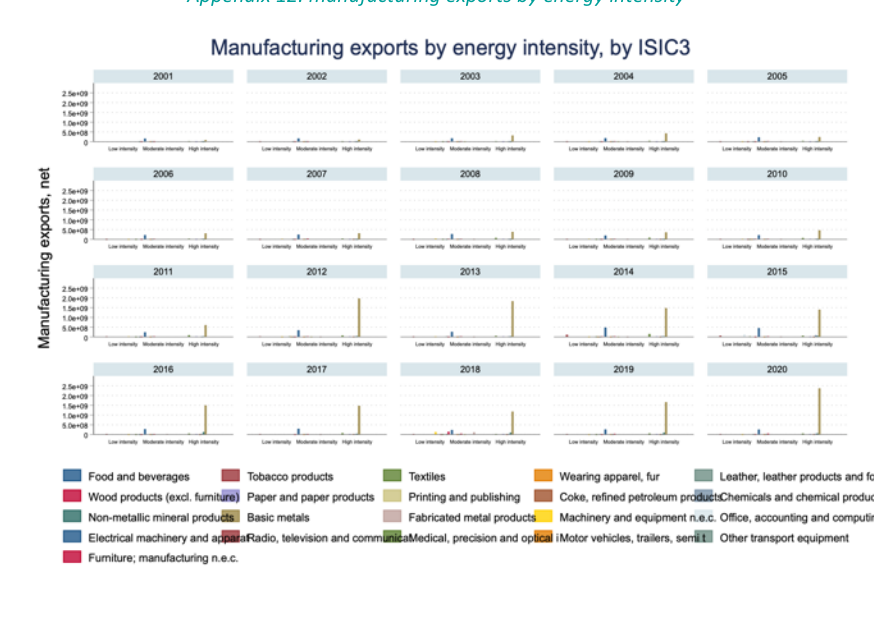
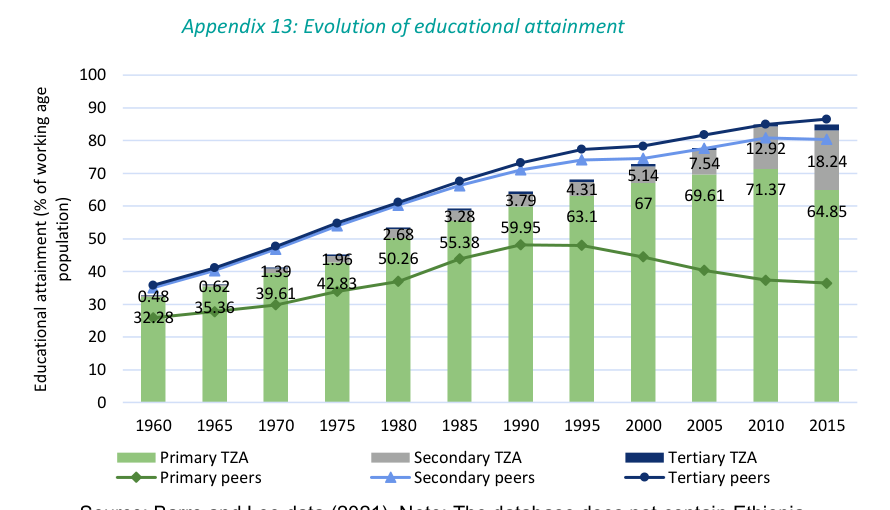
Source: Barro and Lee data (2021). Note: The database does not contain Ethiopia.
Report Growth Diagnostics and Competitiveness Study of the Manufacturing Sector in Tanzania 127
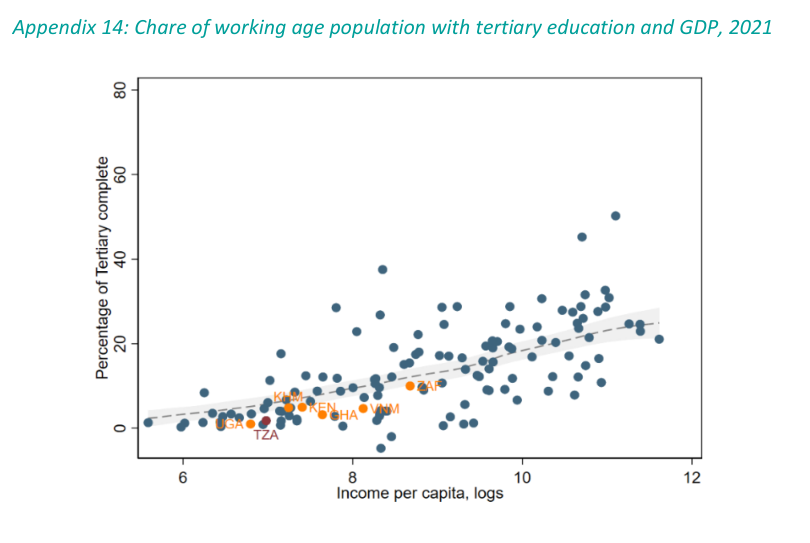
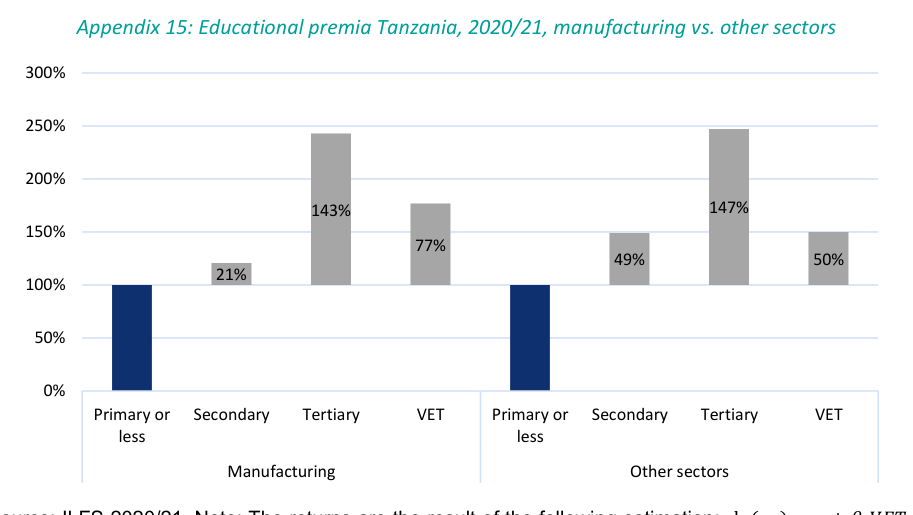
Source: ILFS 2020/21. Note: The returns are the result of the following estimation: ln(w i ) = α+ β 1 VET+ β 2 secondary + β 3 tertiary+ β 4 exp+ β 5 exp 2 + β 6 women+ β 7 urban+ ε i , leaving primary or less as the omitted level. The regression was estimated separately for the manufacturing sector and other sectors.
Report Growth Diagnostics and Competitiveness Study of the Manufacturing Sector in Tanzania 128
Appendix 16: Returns to schooling by level of skills ——————————————————————– (1) (2) (3) High Skills Medium skills Low skills ——————————————————————– yrs 0.138*** 0.0429*** 0.0912*** (0.00222) (0.000397) (0.00111) exp -0.0188*** 0.0225*** 0.00954*** (0.00190) (0.000222) (0.000671) exp2 0.000675*** -0.000403*** -0.000140*** (0.0000476) (0.00000324) (0.0000105) women 0.452*** -0.633*** -0.582*** (0.0171) (0.00213) (0.00663) urban 0 0.307*** -0.0723*** (.) (0.00216) (0.00646) Constant 11.67*** 11.46*** 11.68*** (0.0412) (0.00518) (0.0155) ——————————————————————– Observations 9235 878547 84169 Adjusted R-squared 0.309 0.157 0.224 ————————————————- ———— Standard errors in parentheses. * p<0.1, ** p<0.05, *** p<0.001 Appendix 17: Main obstacles for firms, manufacturing sector Tanzania
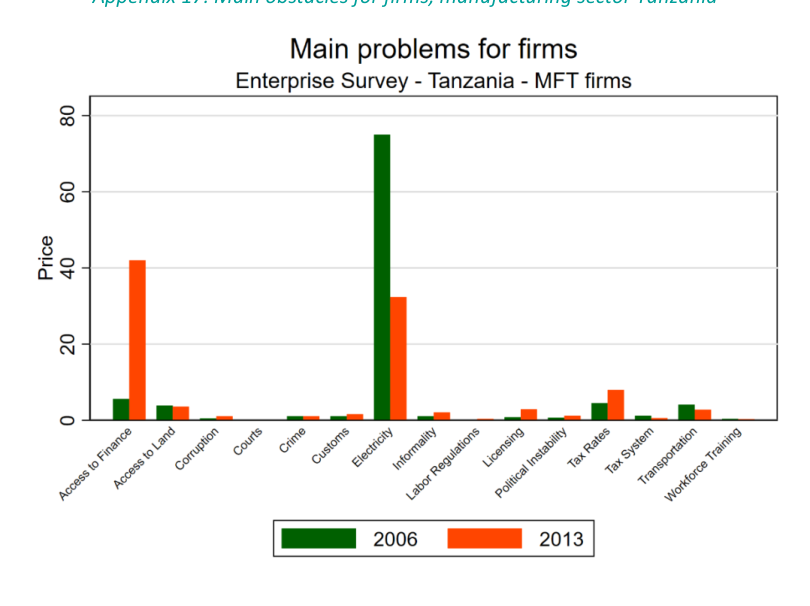
Report Growth Diagnostics and Competitiveness Study of the Manufacturing Sector in Tanzania 129
Appendix 18: Major challenges faced by the establishment, ASIP data
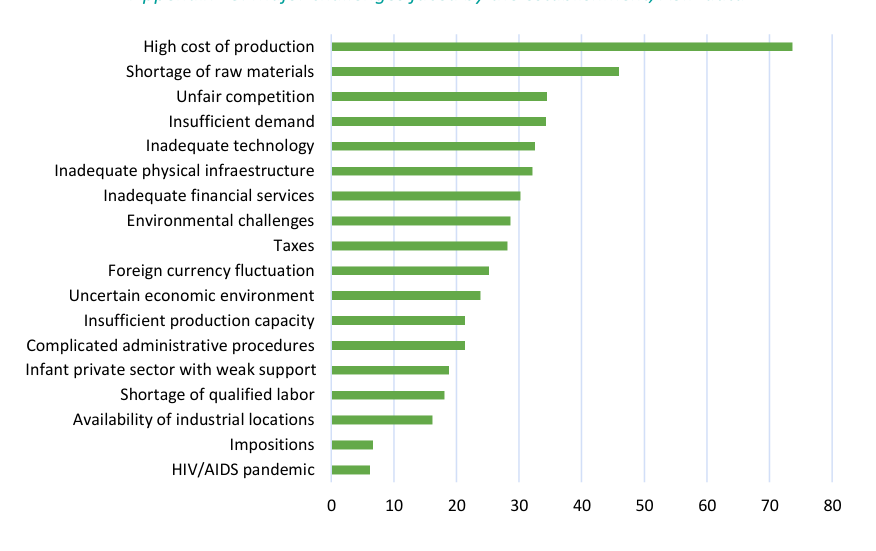
Appendix 19: Informal employment by sector, ILFS 2020/21
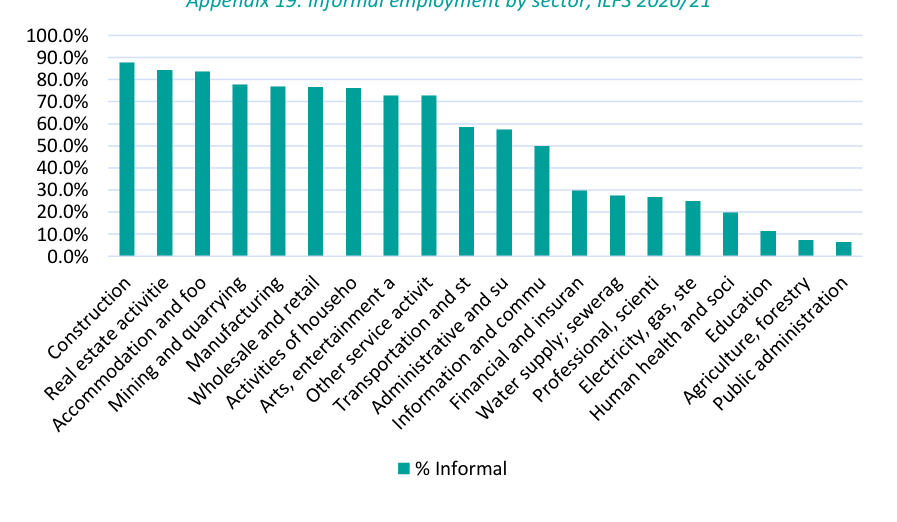
Report Growth Diagnostics and Competitiveness Study of the Manufacturing Sector in Tanzania 130
Appendix 20: Monthly minimum wage by sector Tanzania (2020) USD
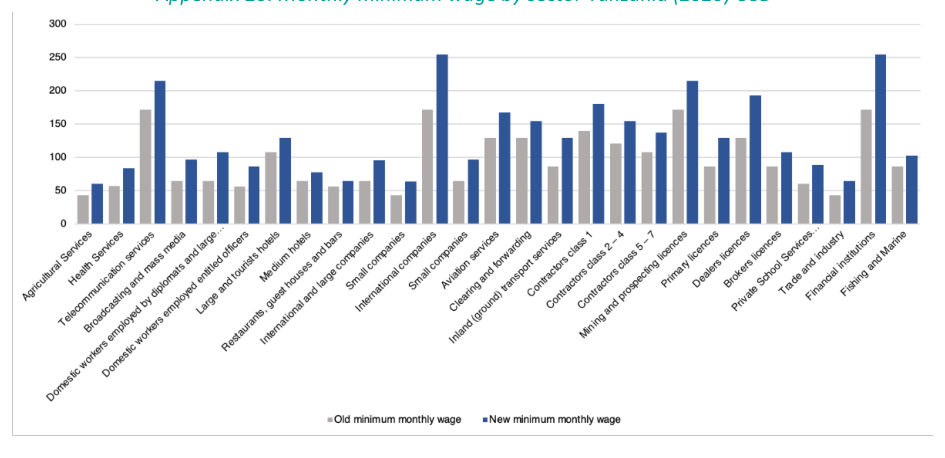
Source: The Ministry of State, Prime Minister’s Office ( Labor, Youth, Employment and Persons with Disability)
Appendix 21: Average monthly earnings by sector, Tanzania (2020, USD)
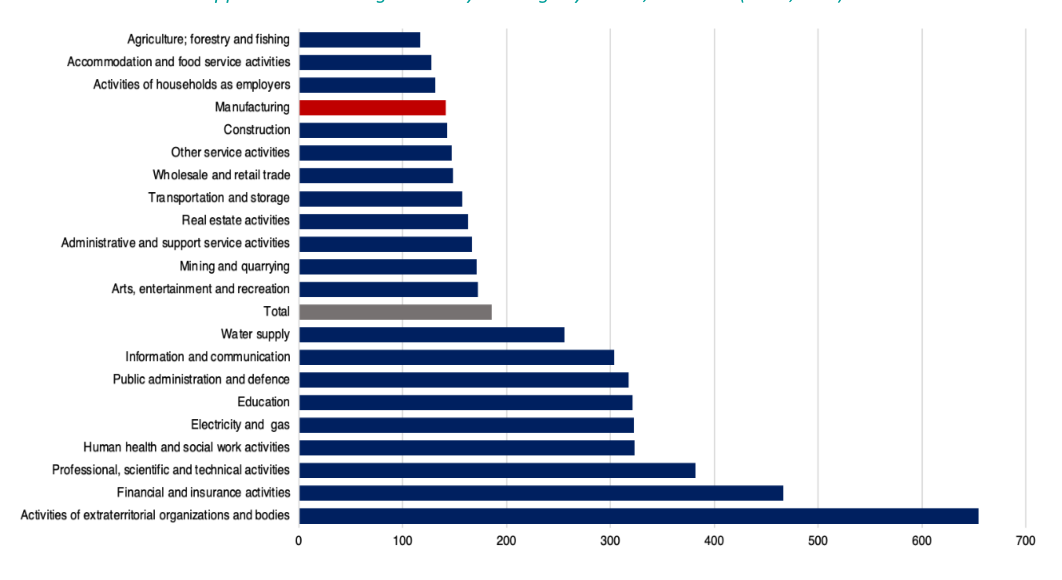
Report Growth Diagnostics and Competitiveness Study of the Manufacturing Sector in Tanzania 131
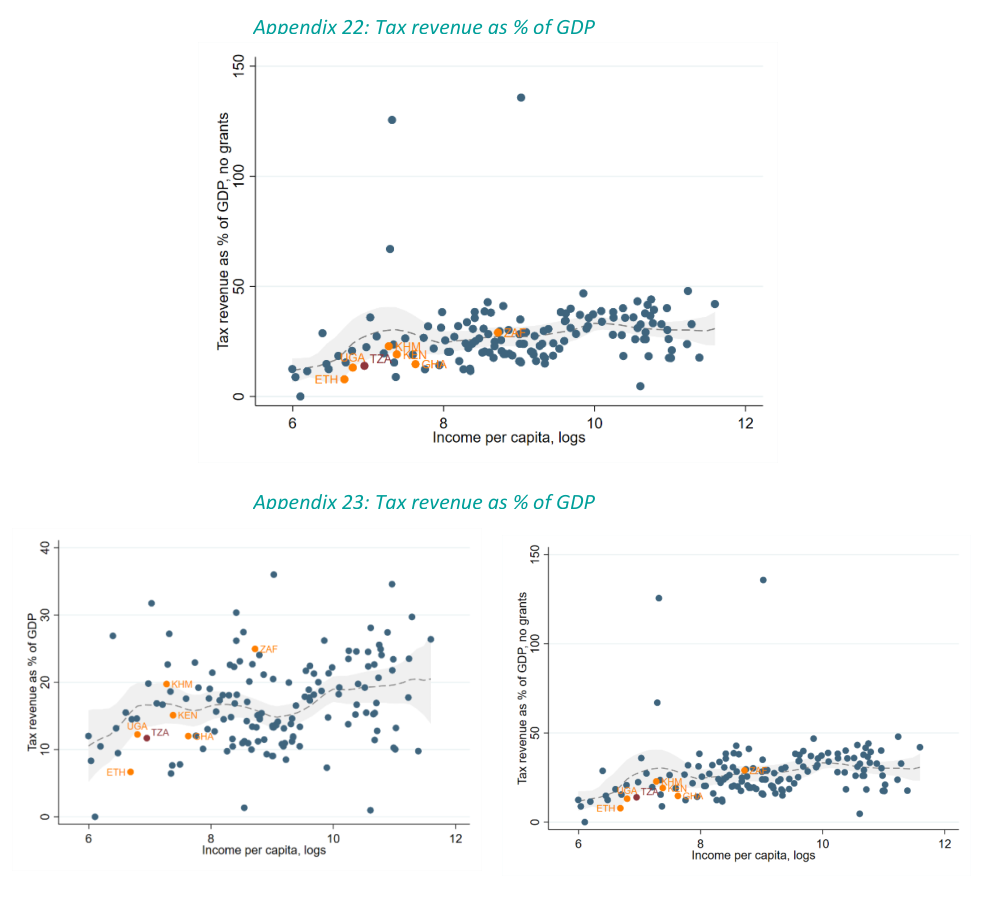
Report Growth Diagnostics and Competitiveness Study of the Manufacturing Sector in Tanzania 132
pp g p y
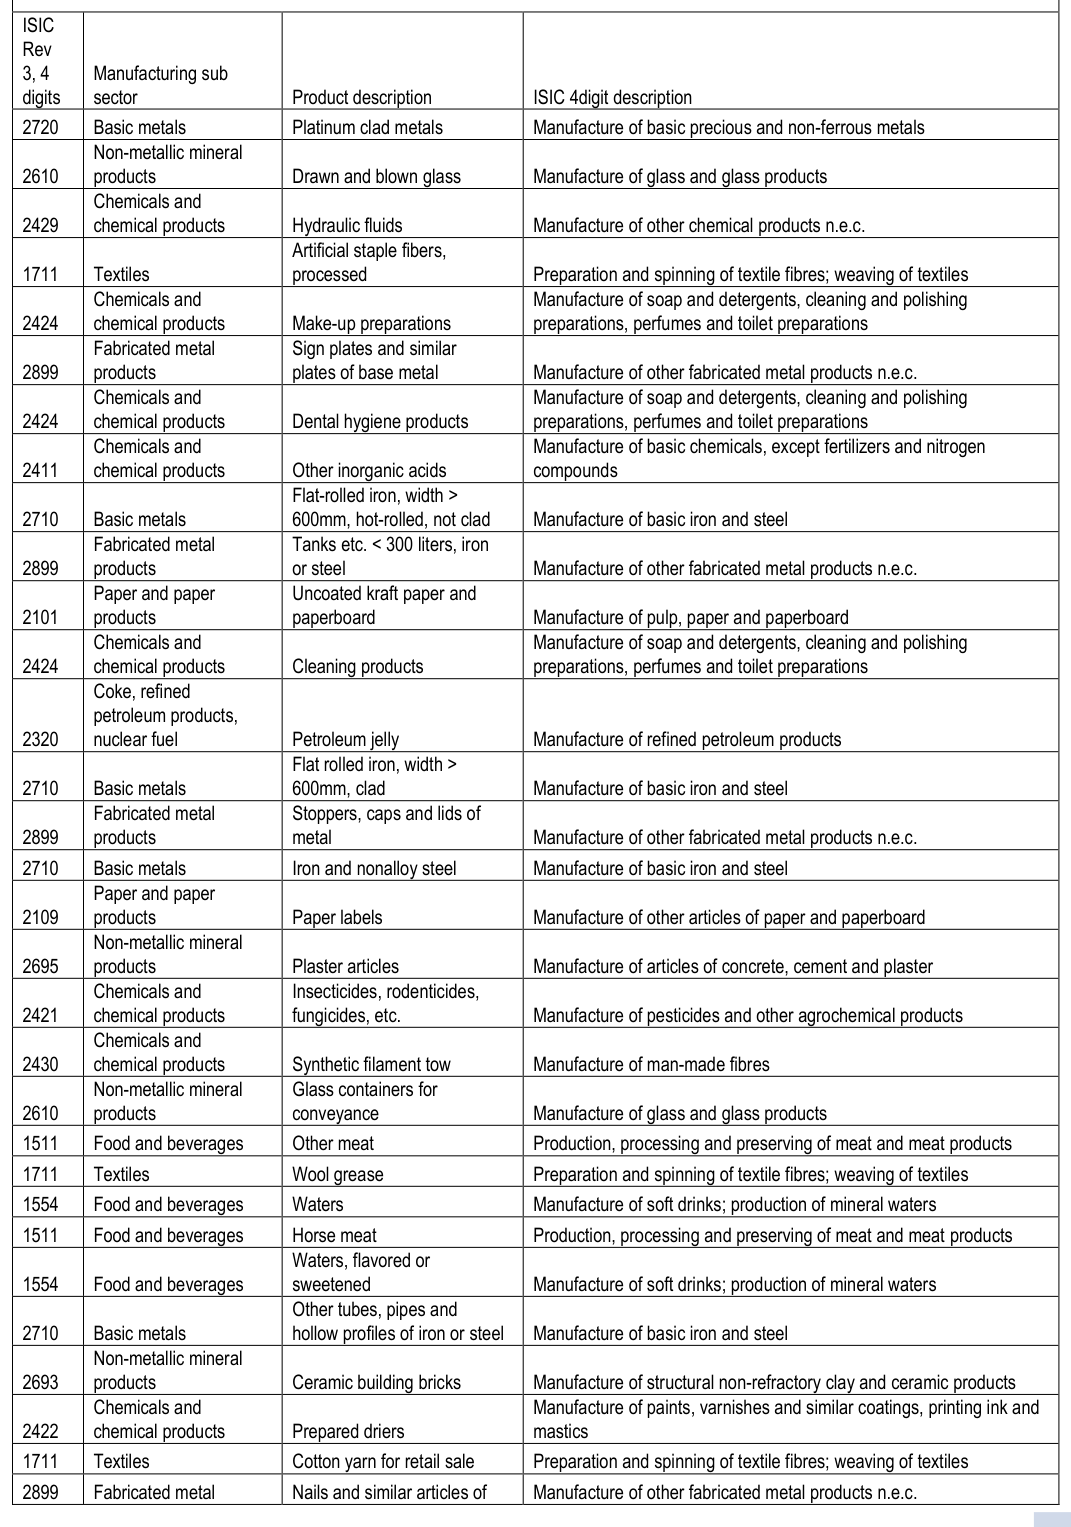
Report Growth Diagnostics and Competitiveness Study of the Manufacturing Sector in Tanzania 133
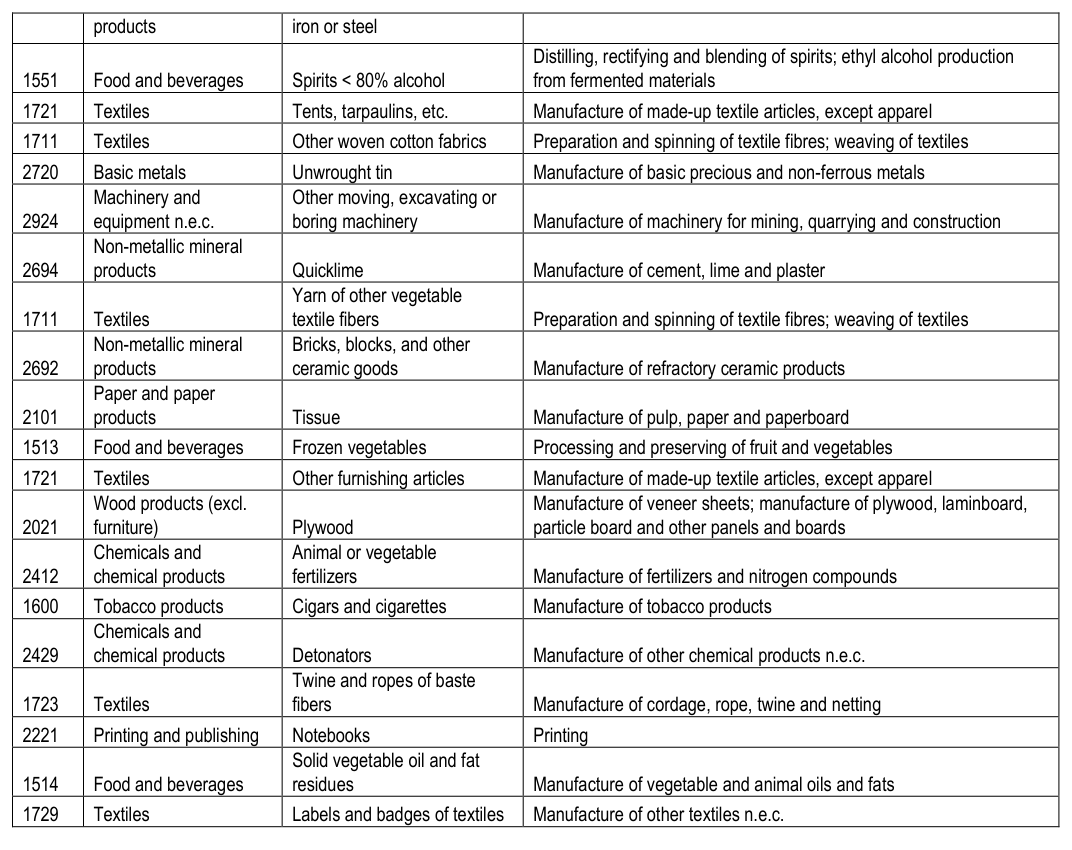
Report Growth Diagnostics and Competitiveness Study of the Manufacturing Sector in Tanzania 134
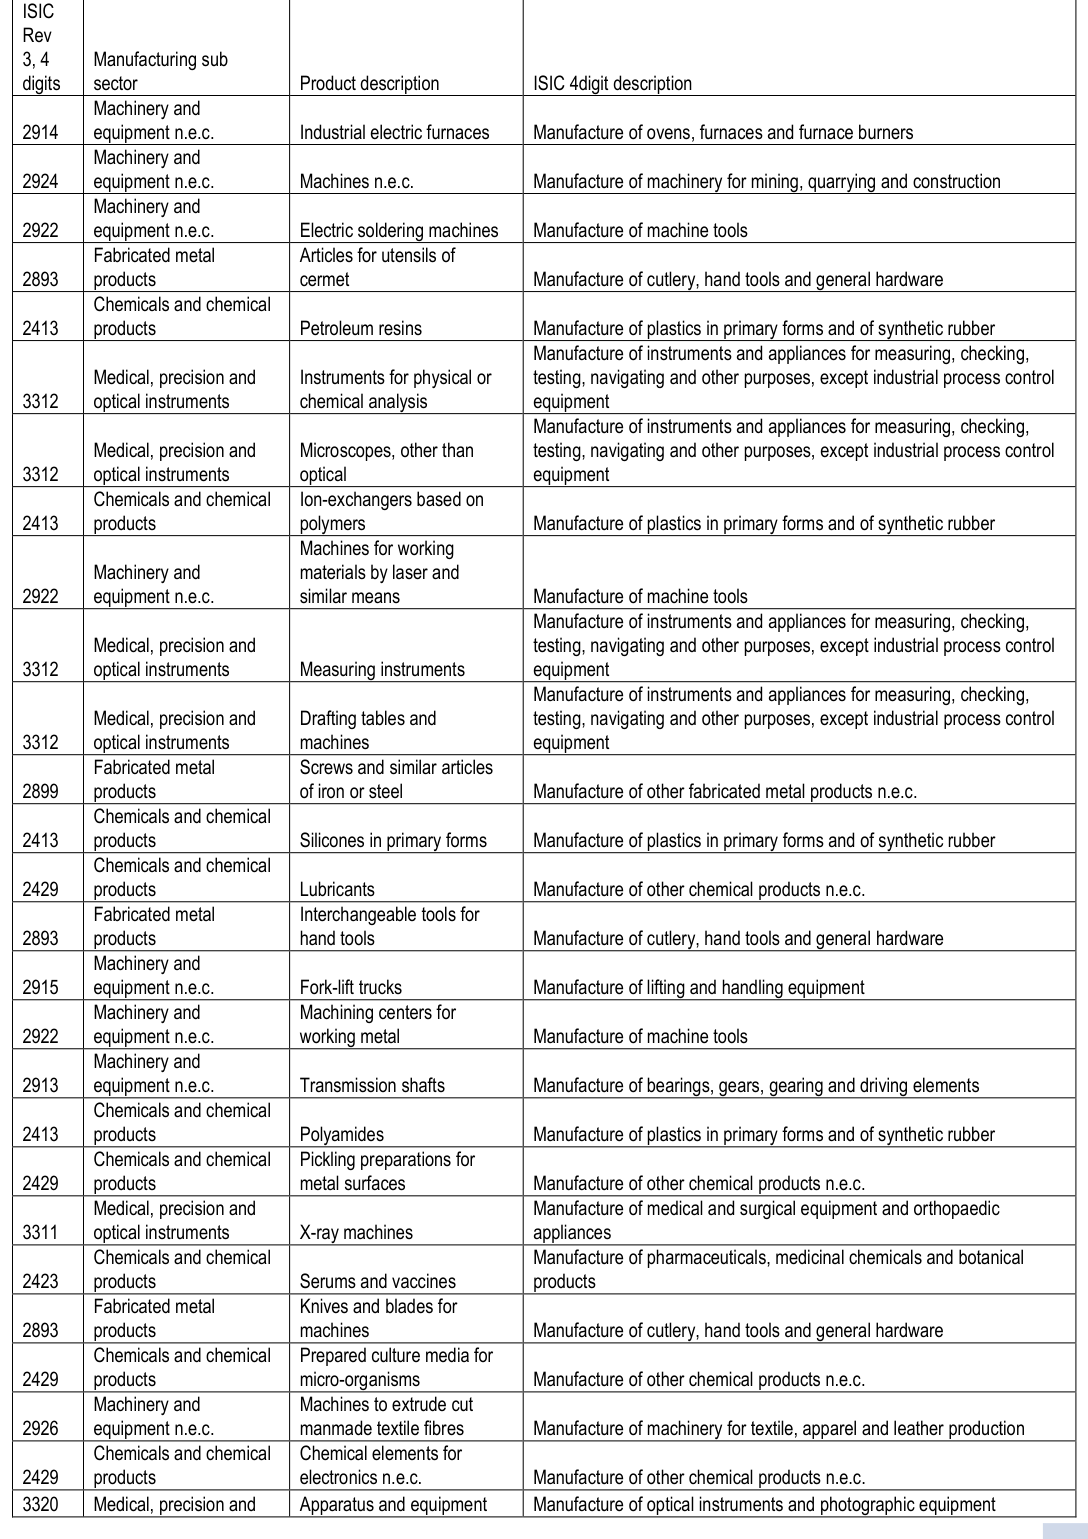
Report Growth Diagnostics and Competitiveness Study of the Manufacturing Sector in Tanzania 135
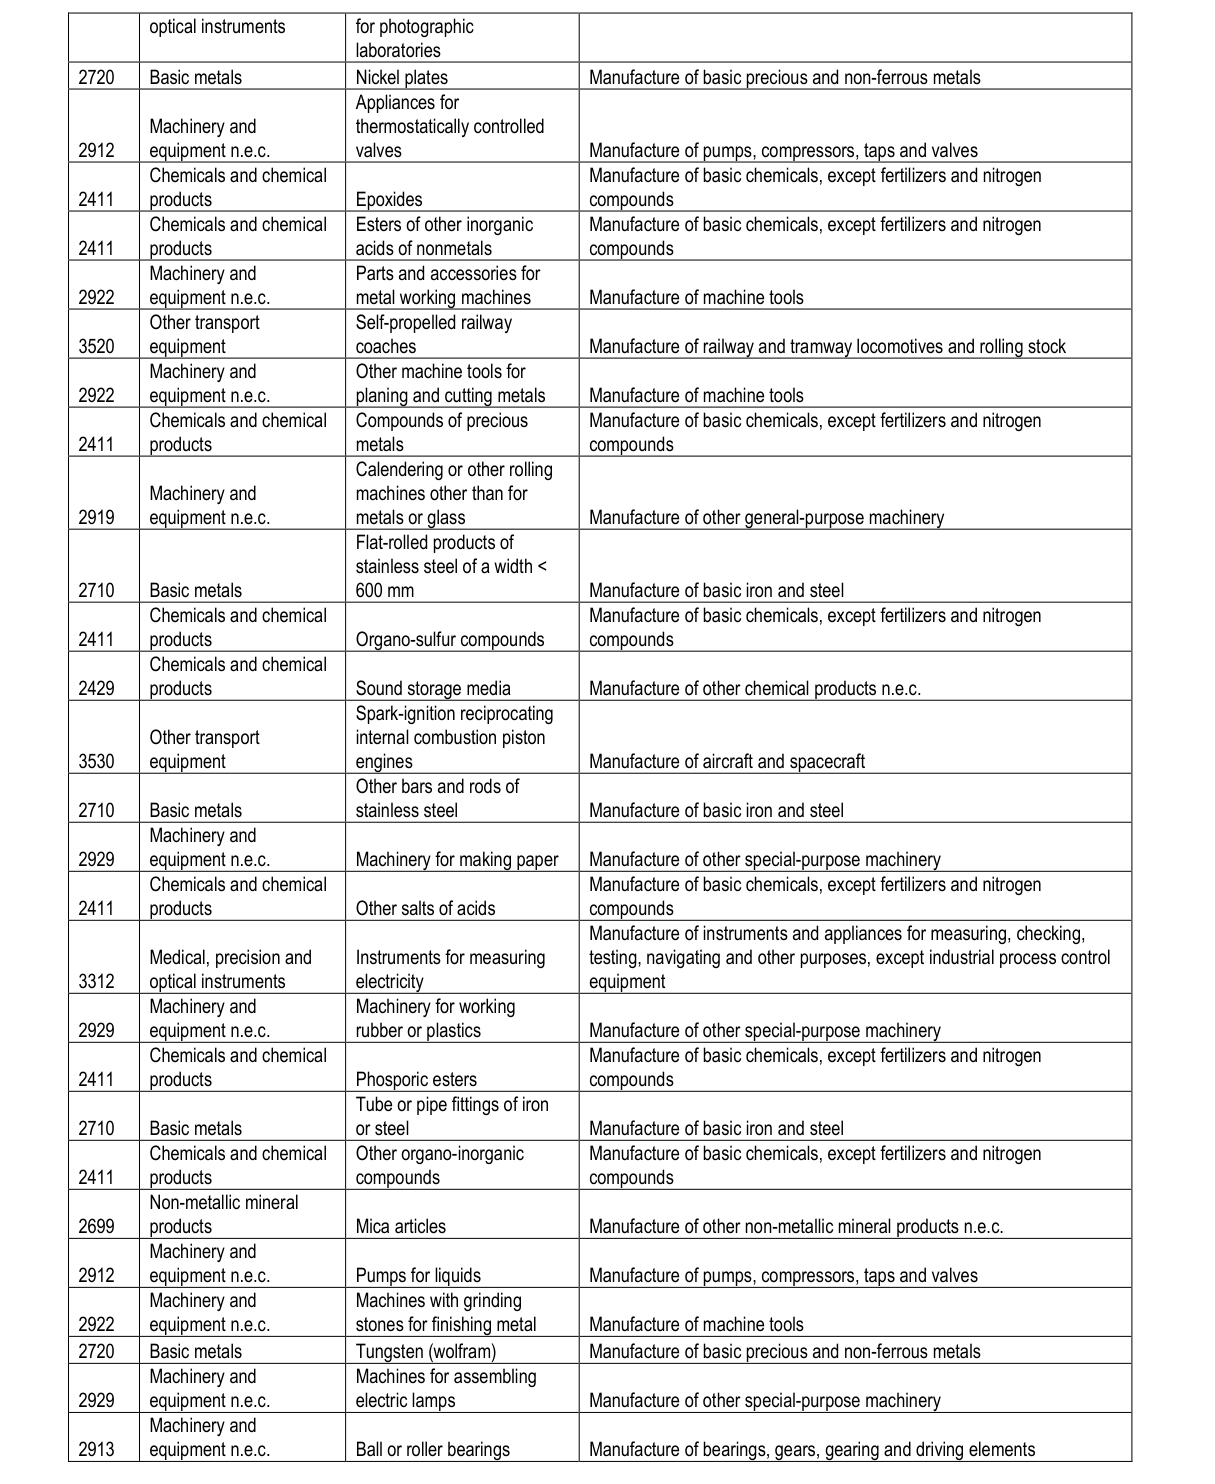
Report Growth Diagnostics and Competitiveness Study of the Manufacturing Sector in Tanzania 136